Pixel Rank Tracking: Why Pixels Beat Positions in Google’s AI-Driven SERP
Last updated: May 2026. Pixel rank tracking measures where your website appears on a search results page in pixels from the top, not just by position number. This approach captures true visibility because a #1 ranking buried beneath AI Overviews, ads, and featured snippets may sit 800+ pixels down, invisible without scrolling. In 2025, pixel rank tracking is essential for understanding real SERP performance.
TL;DR: Traditional rank positions no longer reflect actual visibility. A page ranking #1 can appear below the fold when AI Overviews dominate the top 500+ pixels. Pixel rank tracking measures your true screen position, helping you understand why traffic drops despite stable rankings. Tools like seoClarity and Semrush now offer pixel-depth metrics, and tracking your “share of squares” in AI citations has become the new share of voice.
What Is Pixel Rank Tracking?
Pixel rank tracking is the practice of measuring a webpage’s position on the SERP in terms of pixels from the top of the page, rather than by a simple rank number. Instead of asking “what position am I?” it asks: how far down (in pixels) do users have to scroll before they see my content?
This distinction matters enormously. According to seoClarity research, the “above the fold” threshold is approximately 800 pixels on desktop and 400 pixels on mobile (seoClarity, 2025). If your result appears at 1,200 pixels, most users will never see it without deliberate scrolling, regardless of your numeric ranking.
Traditional rank tracking treats all #1 positions identically. But a search result sitting at 200 pixels from the top delivers vastly different performance than one buried at 1,100 pixels. Pixel ranking captures this nuance by accounting for the varying heights of SERP features, whether there’s a 600-pixel AI answer box ahead of you, a stack of ads, a local pack, or People Also Ask accordions consuming the top of the page.
Pixel Rank Tracking vs. Traditional Position Tracking: A Comparison
| Metric | Traditional Position Tracking | Pixel Rank Tracking |
|---|---|---|
| What it measures | Numeric rank (1, 2, 3, etc.) | Distance from top in pixels |
| Accounts for SERP features | No | Yes |
| Predicts CTR accurately | Decreasingly reliable | Strong correlation |
| Reflects AI Overview impact | No | Yes |
| Above-the-fold visibility | Assumed, not measured | Directly measured |
| Use case in 2025 | Basic reporting only | Strategic decision-making |
This comparison highlights why forward-thinking SEO teams are shifting their primary KPIs. When you’re optimizing for zero-click searches in the AI era, understanding pixel position becomes non-negotiable.
The Decline of Traditional Ranking Metrics in an AI-Driven SERP
For years, SEO success was measured by ranking positions, securing that #1 spot or a handful of top-three rankings. However, Google’s SERP has transformed dramatically. With the introduction of AI Overviews, rich snippets, local packs, and other SERP features, a page that ranks #1 might no longer be the first thing a user sees.
Being “ranked #1” doesn’t guarantee visibility or clicks like it used to.
Consider what happens when Google’s AI-generated answers appear at the top of results. These large info boxes can dominate the screen, pushing traditional organic links further down. The classic blue link that we fought so hard to get to position one might actually be below the fold, visible only after scrolling.
Studies confirm this shift. On modern SERPs for competitive queries like “hotels,” the first organic result can appear only on the second screenful on desktop (Google Search Central, 2024). On mobile, it’s often worse, with small screens and numerous features meaning users might not see an organic result until they scroll significantly.
Data Spotlight: Rankings Up, Clicks Down
The rise of SERP features and AI summaries has led to a paradoxical situation: you maintain high rankings, but organic traffic and click-through rates drop. Multiple independent studies confirm this trend:
- Ahrefs data shows that when an AI Overview is present, the top-ranking page’s CTR is 34.5% lower on average compared to similar queries without an AI answer (Ahrefs, 2025)
- An Amsive analysis found a -15.49% average CTR decline on keywords with AI Overviews (Amsive, 2025)
- Similarweb reported 20% fewer clicks on search results pages that include AI Overviews (Similarweb, 2025)
- SparkToro research indicates 59.7% of Google searches now end without a click to any website (SparkToro, 2024)
Even if you’re ranking #1, the crowded, AI-infused SERP is siphoning off clicks that used to be yours.
All these data points align on one conclusion: traditional rank alone isn’t a reliable measure of success anymore. We need new ways to quantify and track our true visibility. This is where a comprehensive technical SEO audit becomes essential for identifying visibility gaps.
Why Pixel Rank Tracking Matters in 2025
Google’s SERPs have become incredibly crowded and dynamic. Just in the past few years, the content in that coveted first screen has shifted dramatically:
- 2016: A search for “hotels” might show a couple of ads and then the first organic result within the first screen view. Users could see a traditional link without scrolling.
- 2020: The same query started showing more elements, including ads, a local hotel pack, and possibly a featured snippet. The first organic listing was pushed to the second fold.
- 2025: Now add an AI Overview at the top that attempts to answer the query with aggregated info. The AI box takes up a significant portion of the screen on many informational searches. The first “regular” organic result might be several swipes down on mobile or well below 800 pixels on desktop.
In this environment, pixel rank is a lifeline metric. It helps us identify whether a top-ranked page is visible or effectively hidden. For instance, if you have a high-value page ranking #2, traditional reports sound great, but pixel tracking might reveal that #2 actually starts at 900 pixels down, below an AI snippet and a People Also Ask box.
Key takeaway: A page that ranks high but sits below the fold is not winning the traffic it deserves. By monitoring pixel rank, we ensure our SEO success is measured by real-world visibility, not just numeric positions.
Pixels vs. Positions: A Concrete Example
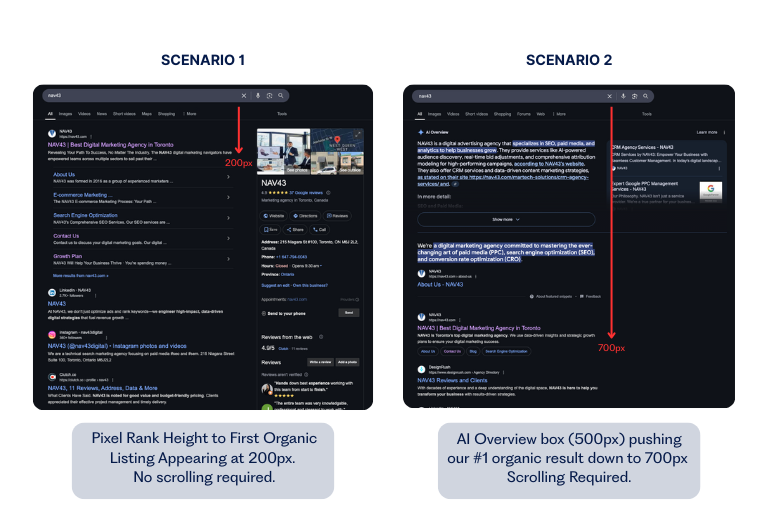
To illustrate the difference, consider these two scenarios for a desktop search result:
Scenario A: Your site is ranking #1 for a keyword. There are no AI answers or special boxes, just perhaps a small ad on top. Your listing appears at approximately 200 pixels from the top, where users can see it immediately. Expected CTR: 28-32%.
Scenario B: Your site is still ranking #1 for the same keyword, but now Google displays a large AI Overview (taking up 500 pixels height) and a featured snippet from another site above you. Your listing, though technically “#1 organic,” doesn’t show up until approximately 750 pixels down, requiring the user to scroll. Expected CTR: 8-12%, a drop of over 60%.
We’ve observed clients perplexed by drops in traffic while their rank tracker still proudly shows “#1.” Pixel rank tracking would have immediately flagged the issue: the page’s pixel rank worsened due to new SERP features.
seoClarity reports that these kinds of SERP changes caused CTR to drop significantly without any change in numeric rank position (seoClarity, 2025). This is why pixel rank matters: it aligns with how humans actually experience the SERP.
Users don’t see “#1”, “#2”, or “#3” labels. They see content blocks at various positions on their screens.
How to Measure Pixel Rank: Tools and Implementation
Shifting from traditional rankings to real-world visibility metrics might sound daunting, but several SEO tools now offer pixel-based tracking. Here’s how to implement pixel rank measurement:
Step 1: Set Up Pixel Depth Tracking
Advanced rank tracking tools now report the pixel position of your results. seoClarity’s Visibility Share tool measures the exact pixel depth of every SERP element to determine if your result was in the first 800 pixels on desktop or 400 pixels on mobile.
Configure your tool to track pixel depth alongside traditional rankings for your priority keywords. This dual-tracking approach reveals discrepancies between rank and actual visibility.
Step 2: Monitor Above-the-Fold Rate
Define a simple metric: the percentage of your tracked keywords where your content is visible without scroll. If out of 100 keywords, 40 show something from your brand in the first screen, you have a 40% above-the-fold rate. Track this weekly and aim for improvement.
Step 3: Track AI SERP Inclusion
Both Rank Ranger and Semrush have introduced ways to specifically track AI-driven results. In Semrush’s Position Tracking, filter for the “AI Overview” SERP feature to see which keywords trigger it and whether your site is included among the AI citations.
Step 4: Correlate with CTR Data
Cross-reference your pixel rank data with Google Search Console CTR metrics. Pages with high pixel depth (appearing lower on screen) should show lower CTR, validating your tracking. Understanding this relationship is fundamental to SEO content marketing best practices.
To navigate Google’s new AI-driven results, there’s a concept we call “share of squares.” When Google provides an AI Overview, it includes grounded links, those little reference cards or “source squares” that appear as citations for the AI’s answer.
Each of these is typically a small snippet or card showing a source website that contributed to the AI summary. Think of an AI Overview as a mini-research report: Google’s AI aggregates information and then cites 3-5 sources with clickable cards so users can verify information or learn more.
Your goal as an SEO is to ensure your content is featured among those squares. The percentage of AI Overviews for your target queries that include your site is your share of squares.
What Exactly is “Share of Squares”?
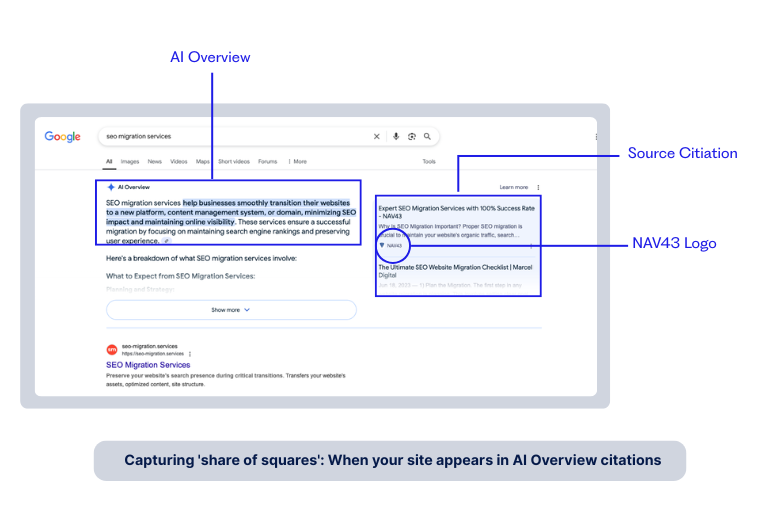
“Share of squares” is your share of visibility within AI-generated answers. For any given AI Overview, if Google shows four reference links and your site is one of them, you’ve captured 25% of that Overview’s real estate. Across a set of queries, if your brand consistently appears in these citations, you have a strong share of squares, a sign of authority and visibility in the AI age.
This metric matters because AI Overviews are becoming more prevalent. By March 2025, over 13% of all search queries in the US triggered an AI Overview, more than double the rate from January (Google Search Central, 2025). Google is essentially curating answers and only spotlighting a few sources. If you’re one of those sources, you gain a visibility boost. If you’re absent, your organic listing might be playing second fiddle to an AI summary that doesn’t mention you.
Google’s own documentation confirms that all links within an AI Overview are treated as having the same rank position, position #1, since the whole AI block occupies the top slot (Google Search Central, 2025). This means in Search Console, you might see an average position of 1 for a query because you were a cited source, even though your traditional listing was lower.
Share of Squares = New Share of Voice: Just as SEOs talk about “share of voice,” share of squares focuses on AI answer visibility. It answers: When Google’s AI summarizes answers in our niche, how often do we show up as a recommended source?
Why “Share of Squares” Matters for SEO
For marketing leaders and SEO practitioners, capturing a solid share of squares has several benefits:
- Credibility and Trust: If Google frequently cites your content in AI Overviews, it’s a strong indicator that your site is considered authoritative on those topics.
- Traffic Opportunities: While some users read the AI answer and move on, many will click a reference to get more detail. If you’re cited, that click can be yours.
- Above-the-Fold Presence: Being in the AI Overview means your brand is literally above all organic results for that query. It’s prime real estate.
- Competitive Edge: If competitors are slow to create content worthy of AI citations, you can leapfrog them in visibility.
Share of squares is an emerging KPI that complements pixel rank. Together, they address both sides of the AI SERP coin: where your content appears on the page, and whether it’s included in the AI-driven answer element at the top. For deeper strategies on AI optimization, explore our guide on how to optimize for AI search in 2025.
Common Pixel Rank Tracking Pitfalls to Avoid
As teams adopt pixel-based metrics, we’ve observed several common mistakes that undermine their effectiveness:
Pitfall 1: Tracking Desktop Only
Mobile SERPs have dramatically different pixel layouts. An above-the-fold result on desktop might be buried on mobile. Always track both device types separately. According to Statista, mobile devices generate approximately 60% of global website traffic (Statista, 2025), making mobile pixel tracking arguably more important.
Pitfall 2: Ignoring SERP Feature Variability
Google tests different SERP layouts constantly. A query might show an AI Overview for 70% of users and not for others. Track pixel rank across multiple data points and time periods to capture this variability.
Pitfall 3: Focusing on Vanity Keywords Only
High-volume head terms often have the most SERP features and worst pixel positions for organic results. Long-tail keywords frequently offer better pixel positions and higher conversion intent. Balance your tracking portfolio.
Pitfall 4: Not Connecting Pixel Rank to Business Outcomes
Pixel rank improvements mean nothing if they don’t translate to traffic and conversions. Always correlate pixel position changes with actual CTR and revenue metrics.
Pitfall 5: Treating Pixel Rank as Static
SERP layouts change frequently. A page that’s above the fold today might be buried next month when Google adds a new feature. Implement continuous monitoring, not one-time audits.
Visual SERPs: Measuring and Optimizing Above-the-Fold Presence
Modern SERPs are highly visual and interactive, especially with Google’s move toward an AI-driven interface. It’s not just about the blue links anymore. It’s about images, answer panels, carousels, and more.
On desktop, above-the-fold is roughly the first 800 pixels of height. On mobile, it’s around 400 pixels. Our goal is to have important brand content appear in that zone.
Metrics to Measure Visual Presence
- Pixels from Top: Track the pixel distance of your listing from the top. If a result is at 1,200 pixels, that’s clearly below most folds.
- Percentage of SERP Real Estate: Estimate what percentage of the first screen is occupied by your content. If your site has an image in a carousel at the top that takes 30% of the screen and also an organic listing that takes another 20%, you’ve got a 50% share of the first-view real estate.
- Above-the-Fold Rate: Track the percentage of your keywords where your content is visible without scroll.
Tactics to Optimize Above-the-Fold Presence
Secure Featured Snippets
Featured snippets often appear at or near the top, even alongside AI Overviews. By structuring your content to answer questions clearly with Q&A format, bullet points, and definitions, you increase your chances of capturing a snippet.
This not only gives you prime placement but can also feed the AI Overview. Google might use your snippet content in its AI answer, effectively giving you a double-whammy: you’re the snippet and a cited source.
Leverage FAQ and How-To Schemas
Adding FAQ schema or How-To schema can expand your organic listing, sometimes adding collapsible Q&A under your link or a rich how-to carousel. These enhancements make your result taller and more prominent.
A result with FAQ schema can take up significantly more vertical space, potentially moving competing links further down. We’ve seen cases where implementing FAQ schema turned a one-line listing into a chunky block that owns a big slice of the screen.
Optimize for Image and Video SERP Features
Visual content can appear at the top as horizontal scrollable galleries. For e-commerce, this is significant, as product image results or “Popular Products” might show up before organic links.
Ensure your images are optimized with good filenames, alt text, and schema so that your products or graphics show up in those carousels. If an image of your product appears at the very top, that’s an above-the-fold win for visibility.
Use Paid and Local as Supplemental Strategies
While this article focuses on SEO, don’t overlook the obvious. If an above-the-fold spot is consistently occupied by an ad or a local pack and you’re not there, consider paid search or local SEO improvements as a stop-gap while you build organic visibility.
Frequently Asked Questions About Pixel Rank Tracking
What tools support pixel rank tracking in 2025?
Several enterprise SEO platforms now offer pixel-based metrics. seoClarity provides Visibility Share with exact pixel depth measurements. Semrush and Rank Ranger offer AI Overview tracking and visibility scores that account for SERP features. For budget-conscious teams, manual SERP screenshots with pixel measurement tools can provide directional data.
How often should I check pixel rank metrics?
For high-priority keywords, weekly monitoring is recommended. Google’s SERP layouts can change rapidly, especially as AI Overviews roll out to new query types. Monthly tracking is sufficient for long-tail keywords with less competitive SERPs.
Does pixel rank tracking replace traditional rank tracking?
No. Pixel rank tracking complements traditional position tracking. You still need to know your numeric rank for benchmarking and historical comparison. Pixel rank adds the crucial context of whether that position actually delivers visibility. Use both metrics together for complete SERP intelligence.
Conclusion: Adapting Your SEO Strategy for Pixel-Based Visibility
The shift from position-based to pixel-based SEO measurement isn’t optional. It’s a necessary evolution as Google’s SERPs become increasingly dominated by AI Overviews, rich features, and visual elements that push traditional organic results down the page.
Here’s what you should do next:
- Audit your current visibility: For your top 20 keywords, manually check pixel position and note any that appear below 800 pixels on desktop.
- Implement pixel tracking: Add pixel-depth monitoring to your SEO reporting stack using seoClarity, Semrush, or similar tools.
- Track share of squares: Monitor which of your pages get cited in AI Overviews and calculate your share across target queries.
- Optimize for above-the-fold: Prioritize featured snippets, schema markup, and visual content that can capture top-of-SERP real estate.
- Connect to business metrics: Correlate pixel position improvements with actual CTR and conversion changes.
At NAV43, we’ve helped SaaS and e-commerce brands navigate this transition, implementing pixel-based tracking and optimizing for the AI-driven SERP reality. The brands that adapt fastest will capture the visibility that others are losing to below-the-fold obscurity.
Ready to understand your true SERP visibility? Contact NAV43 for a comprehensive visibility audit that goes beyond traditional rankings to measure what actually matters in 2025’s AI-driven search landscape.
