AI Search Visibility Dashboard: The Metrics You Need to Track Weekly (And How to Build a System That Actually Works)
Only 30% of brands remain visible in back-to-back AI responses for the same query (AirOps, 2025-2026). Let that sink in. Run the same search in ChatGPT twice, and there’s a 70% chance your brand disappears between responses.
If you’re not tracking your AI search visibility weekly, you’re flying blind in the most volatile search environment we’ve ever seen.
I was reviewing a client’s analytics dashboard last week, the kind of dashboard that would have been considered comprehensive six months ago. Traffic sources, keyword rankings, conversion rates, all the traditional metrics. Beautiful data, beautifully visualized, and almost completely useless for understanding how their brand appears in the new AI-driven search landscape.
Here’s the reality: AI Overviews now appear in 25.11% of Google searches, up from 13.14% in March 2025 (Conductor, 2025-2026). That’s nearly double in less than a year. Meanwhile, 94% of B2B buyers now use GenAI for self-guided research (Forrester, 2026). Your prospects are asking ChatGPT, Perplexity, and Google’s AI Mode about your category before they ever type your URL into a browser.
The old playbook of measuring clicks and rankings was built for a world where Google sent you traffic. The new playbook needs to measure something fundamentally different: whether AI systems know you exist, trust you enough to cite you, and describe you accurately when they do.
This article delivers exactly that. You’ll get a complete weekly tracking framework, the six core metrics that actually matter, a day-by-day cadence you can implement immediately, and a system to connect AI visibility to revenue, something almost no one is doing well yet.
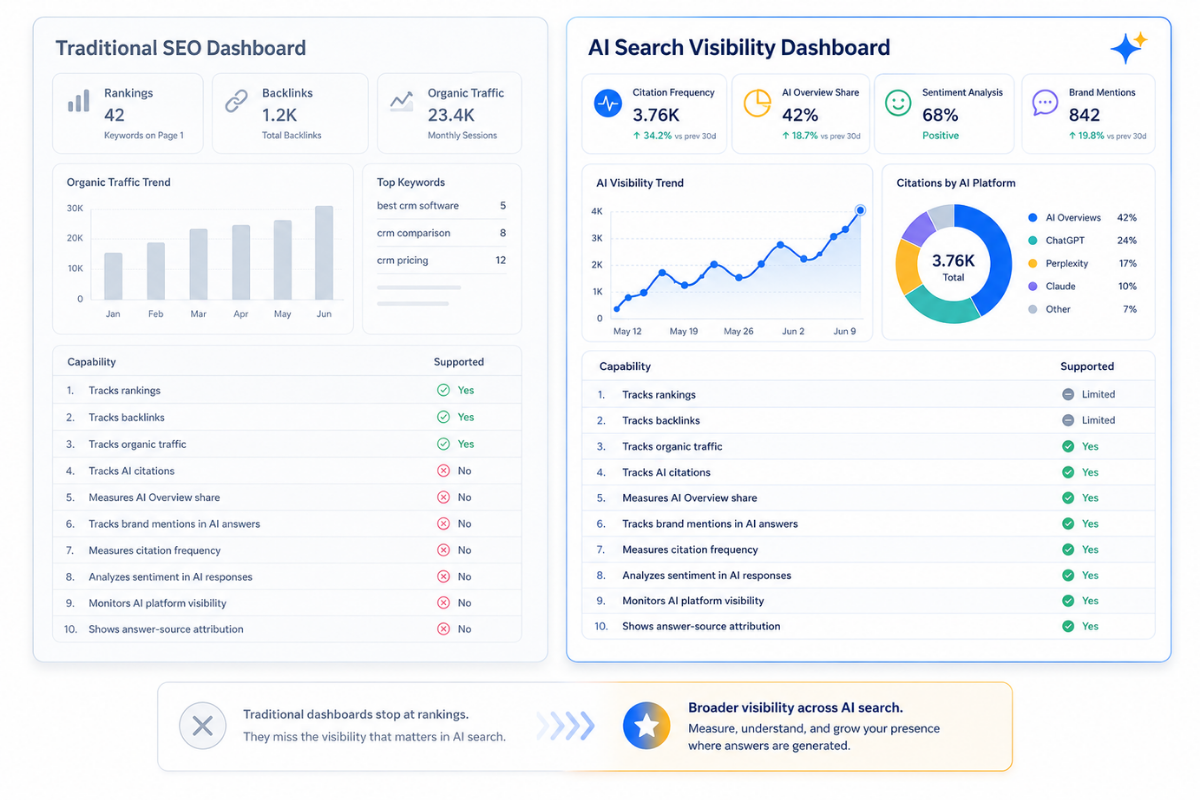
Why Traditional SEO Dashboards Are Now Incomplete
![]()
The Visibility Gap You Can’t Afford to Ignore
Traditional SEO dashboards track what happens after the click. Rankings, traffic, bounce rates, conversions. All of it assumes users clicked through to your site. That assumption is now fundamentally broken.
Around 93% of AI Mode searches end without a click (Semrush, September 2025). Not 30%, not 50%. Ninety-three percent. When a user asks Perplexity, “What’s the best CRM for mid-market B2B companies?” they get an answer synthesized from multiple sources without ever visiting any of those sources directly.
This sounds catastrophic until you look at the quality side. AI search traffic converts at 14.2%, compared with Google’s 2.8% (Exposure Ninja). The visitors you do get from AI referrals are dramatically more qualified; they’ve already been educated, pre-sold, and are looking for validation rather than discovery.
The volume numbers tell an interesting story of rapid growth from a small base. AI referral traffic accounts for just 1.08% of all website traffic on average, with 87.4% of that originating from ChatGPT (Conductor, 2026). But ChatGPT referral traffic grew 206% in 2025 (Semrush, April 2026), and AI-referred sessions jumped 527% year-over-year in the first five months of 2025 (Previsible).
We’re in early mover territory. The brands building tracking systems now will have compounding advantages as this channel matures: understanding patterns, optimizing content, and capturing share while competitors are still debating whether AI search matters.
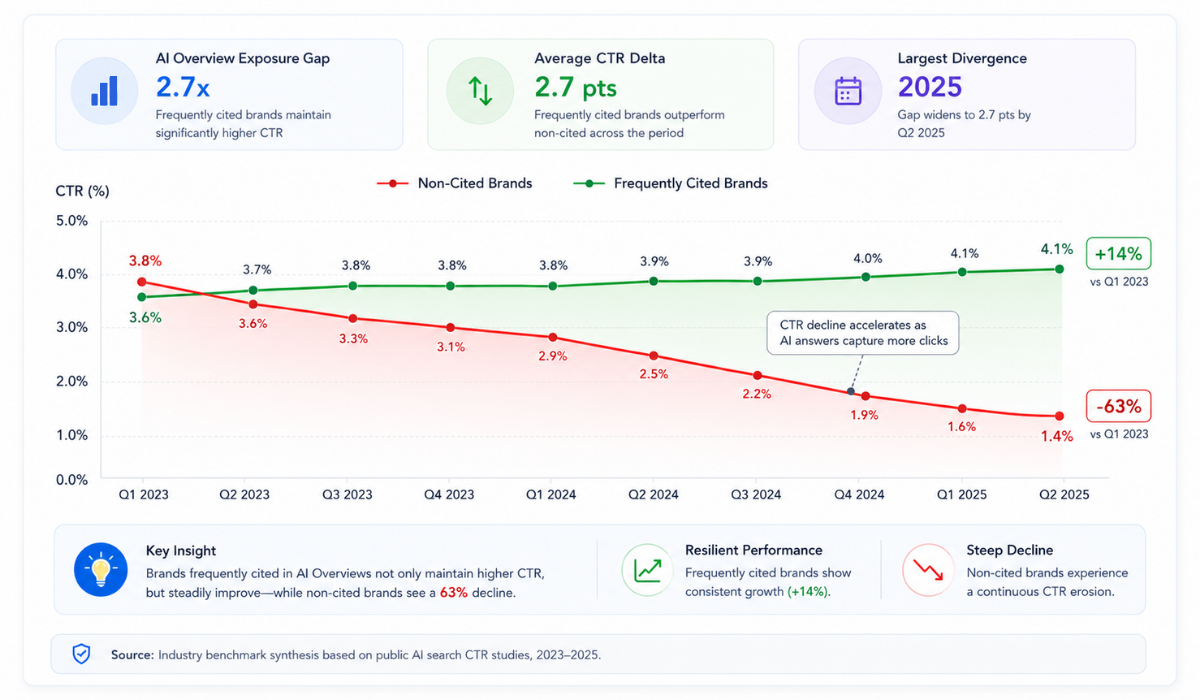
The CTR Collapse for Non-Cited Brands
The data on what happens when AI Overviews appear is stark. Organic CTR for queries with AI Overviews dropped 61%, from 1.76% to 0.61% (Seer Interactive, September 2025). Paid CTR dropped even harder, falling 68% from 19.7% to 6.34%.
For position one content specifically, AI Overviews reduce organic click-through rate by 58% (Ahrefs, December 2025). If you’ve spent years building #1 rankings, those rankings now generate roughly half the clicks they did before AI Overviews rolled out broadly.
But here’s the critical nuance: brands cited within AI Overviews earn 35% more organic clicks and 91% more paid clicks than those not cited (Seer Interactive, 2025). Being visible in the AI answer doesn’t just maintain your traffic. It amplifies it.
This creates a binary outcome. Either you’re cited in AI answers and benefit from increased visibility across all channels, or you’re not cited and watch your hard-won rankings generate progressively fewer clicks.
Your AI search visibility dashboard isn’t just a nice-to-have analytics project. It’s a defensive strategy to protect existing organic performance and an offensive strategy to capture a growing channel before competitors catch on.
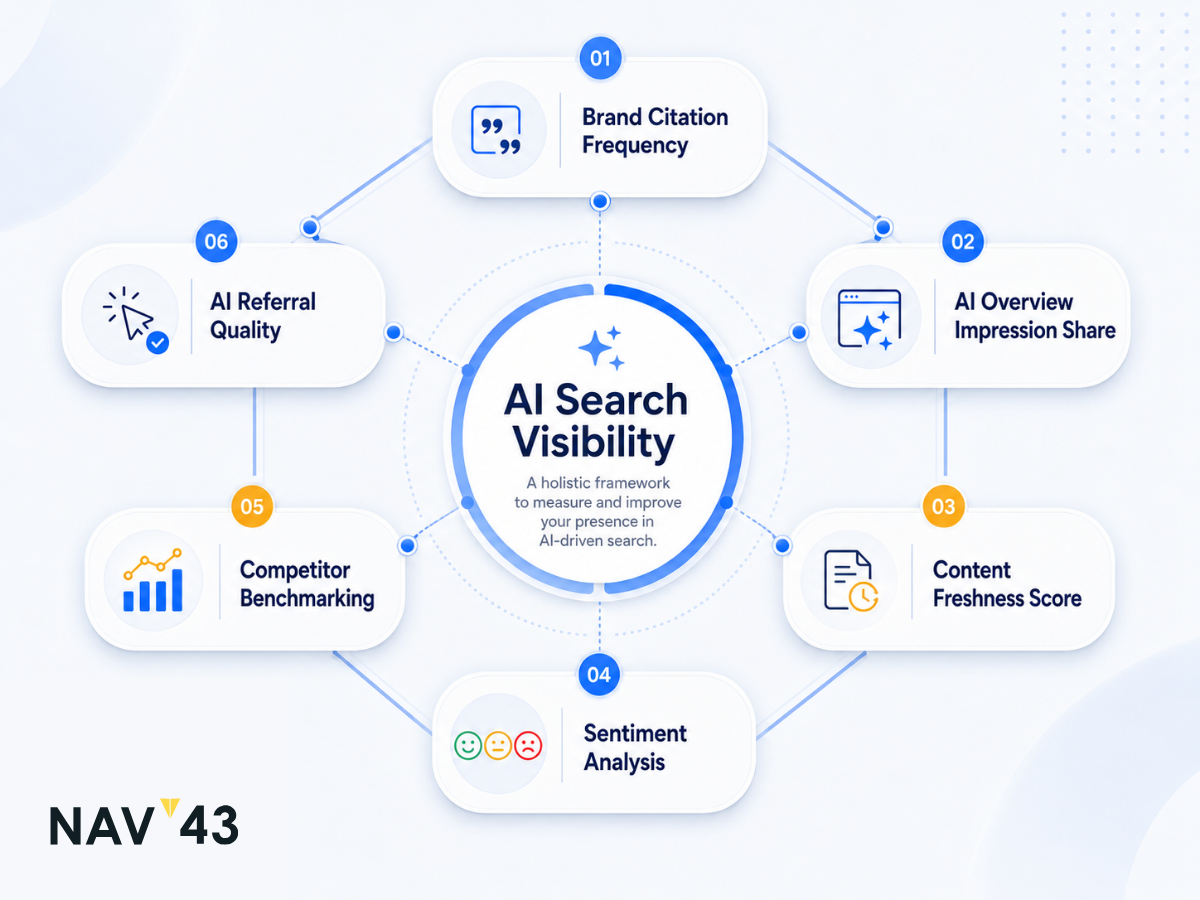
The Six Core Metrics for Your AI Search Visibility Dashboard
Metric 1: Brand Citation Frequency
Brand citation frequency is the foundational metric: how often AI systems mention your brand when users ask questions in your category. Think of it as the new version of ranking position. Instead of asking “where do I rank for this keyword,” you’re asking “does this AI system know to mention me for this topic?”
A citation isn’t just your URL appearing in a footnote. It includes:
- Direct mentions: The AI explicitly names your brand in its response
- Source links: Your content appears in the citations or references
- Contextual references: Your methodology, research, or framework is described even without your brand name
Tracking requires monitoring across multiple platforms. ChatGPT dominates referral traffic, accounting for 87.4% of all AI referral traffic (Conductor 2025-2026), but your B2B prospects might live on different platforms entirely. One pattern we’ve observed with clients: the same brand can see citation volumes differ by 615x between platforms. You might appear constantly on Perplexity and never on Claude, or vice versa.
Citation Tracking Checklist:
- [ ] ChatGPT (web interface and API responses)
- [ ] Perplexity (standard and Pro modes)
- [ ] Google AI Overviews (desktop and mobile)
- [ ] Microsoft Copilot
- [ ] Gemini
- [ ] Claude (for technical/developer audiences)
Track both total citations per week and citation rate by query category. If you’re getting cited for branded queries but not category-level informational queries, that tells you exactly where to focus content investment.
Metric 2: AI Overview Impression Share
Impression share in the AI context measures what percentage of relevant queries for your category show your brand in the AI answer. It’s competitive intelligence translated into a single metric.
If there are 50 queries you care about in your space and you appear in AI answers for 12 of them, your impression share is 24%. More importantly, tracking this weekly shows you whether you’re gaining or losing ground.
Industry variance is significant here. Healthcare content appears in AI Overviews 48.7% of the time, while ecommerce sees just 18.5% (industry benchmarks. Your baseline expectations need to account for the AI Overview prevalence in your category.
Segment your tracking by query type:
- Branded queries: “What is [Your Brand]” or “[Your Brand] reviews”
- Non-branded category queries: “best [product category] for [use case]”
- Comparison queries: “[Your Brand] vs [Competitor]”
- Problem/solution queries: “how to solve [problem you address]”
Non-branded category queries are where the real opportunity lives. Winning those citations means capturing demand before users even know you exist.
Metric 3: Content Freshness Score
This metric connects directly to AI citation mechanics. Fifty percent of the content cited in AI answers is less than 13 weeks old. Pages updated within 60 days are 1.9x more likely to appear in AI answers (BrightEdge, 2025).
AI systems favor fresh content because fresh content signals ongoing relevance and accuracy. A guide published in 2023 and never updated sends a different trust signal than content maintained with current information.
Your content freshness score should track:
- Days since last update for each page in your AI citation target list
- Percentage of priority pages updated in the last 60 days
- Staleness risk level for pages approaching the 60-day threshold
We recommend building a simple scoring system. Green status for pages updated within 30 days, yellow for 31–60 days, red for 60+ days. Review this weekly and queue content refreshes before pages fall into red status.
The aggressive refresh cycle this demands is a strategic advantage. Most competitors aren’t updating content at this pace, which means consistent freshness becomes a differentiation factor in AI citations.
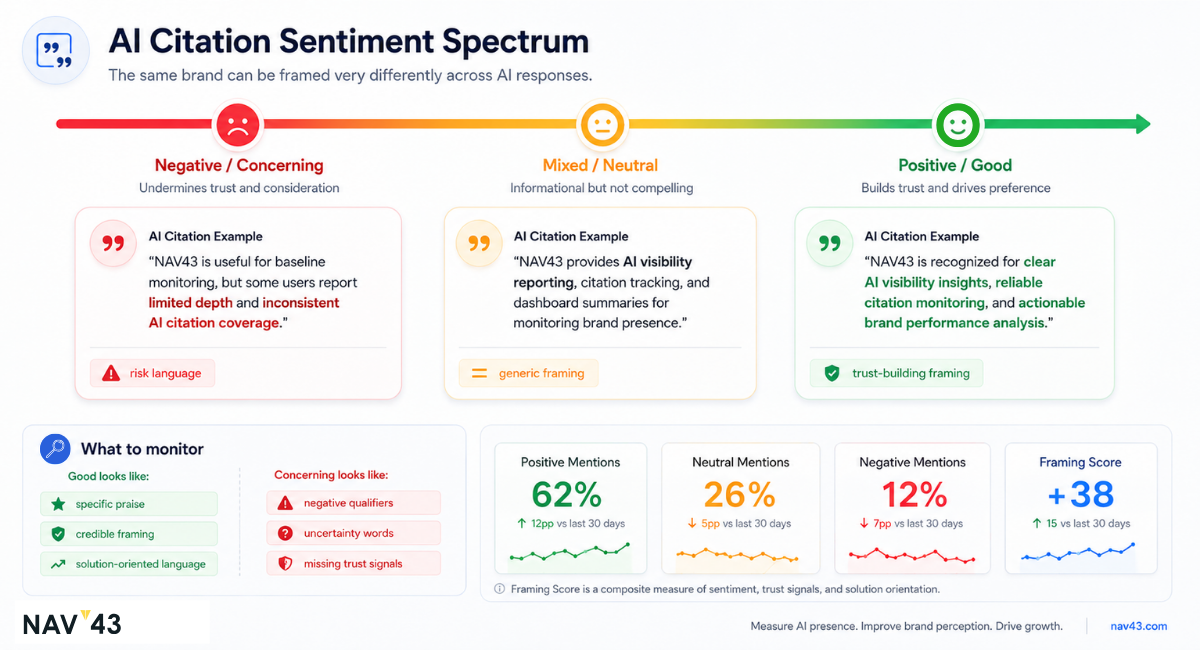
Metric 4: Sentiment and Framing Analysis
![]()
Being cited isn’t enough. How you’re described matters enormously. A brand mentioned as “the industry leader in X” occupies a very different position than a brand mentioned as “an option to consider alongside competitors” or worse, “a solution that has faced criticism for Y.”
This metric tracks the qualitative dimension of AI visibility:
- Positive framing: Described as a leader, recommended first, and attributed authority
- Neutral framing: Listed among options, described factually without endorsement
- Negative or qualified framing: Mentioned with caveats, positioned as inferior, cited as a cautionary example
Here’s an example that illustrates the difference:
Positive citation: “For B2B marketing automation, HubSpot is the leading choice for mid-market companies, offering comprehensive features and strong integration capabilities.”
Qualified citation: “HubSpot is one option for B2B marketing automation, though some users report that pricing escalates significantly as contact lists grow.”
Same brand, same query, dramatically different impact on the reader.
Automated sentiment-tracking tools help at scale, but weekly manual spot checks on your highest-priority queries are essential. AI responses change frequently, and understanding the nuance of how you’re framed requires human judgment.
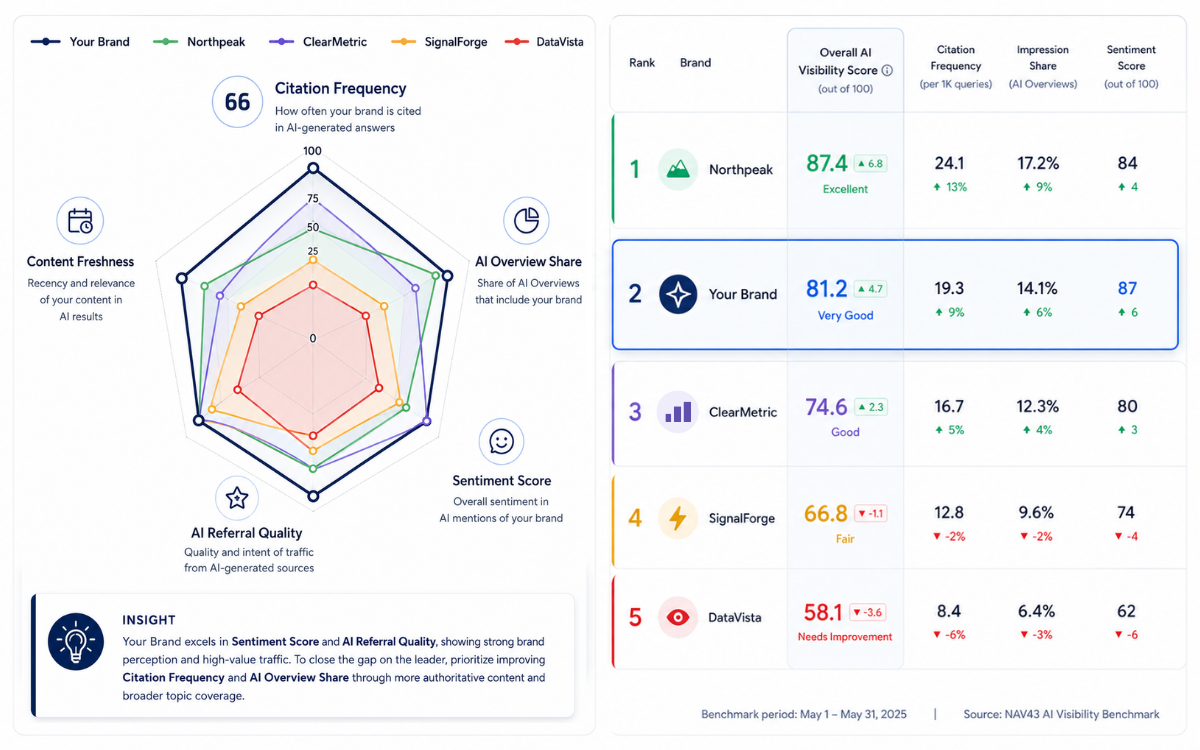
Metric 5: Competitor AI Visibility Benchmarking
Your AI visibility exists in a competitive context. Tracking your share of voice relative to direct competitors reveals opportunities and threats you’d otherwise miss.
This metric answers three questions:
- Where are competitors getting cited that you’re not? These are content gaps to prioritize.
- Where are you winning citations that competitors aren’t? These are strengths to reinforce.
- What content formats and freshness patterns correlate with competitor citations? These are tactics to evaluate.
Build a simple competitive tracking table:
| Query Category | Your Citations | Competitor A | Competitor B | Competitor C |
|---|---|---|---|---|
| Product comparison | 3/10 | 7/10 | 4/10 | 2/10 |
| How-to guides | 8/15 | 5/15 | 9/15 | 3/15 |
| Industry insights | 2/8 | 6/8 | 3/8 | 5/8 |
This view immediately highlights that Competitor A is winning product comparison queries while Competitor B dominates how-to content. Your response can be targeted rather than generic.
Track competitor content freshness and structured data implementation as well. If a competitor suddenly starts winning citations they didn’t win before, investigating what changed on their site reveals tactics you can apply.
Metric 6: AI Referral Traffic Quality Metrics
The final core metric moves from visibility to business impact. AI referral traffic deserves its own segment in your analytics, distinct from general organic search traffic.
In Google Analytics 4, create a segment for AI referral sources:
- chat.openai.com (ChatGPT web)
- perplexity.ai
- copilot.microsoft.com
- gemini.google.com
Track not just volume but engagement and conversion:
- Sessions: Raw referral count from each AI platform
- Engagement rate: Are these visitors engaging with your content or bouncing?
- Pages per session: How deeply are they exploring?
- Conversion rate: Are they taking desired actions?
The 14.2% conversion rate for AI traffic versus 2.8% for Google (Exposure Ninja) is an average. Your specific numbers might vary significantly across AI platforms and content types. ChatGPT referrals to a pricing page behave differently from Perplexity referrals to a how-to guide.
Understanding these patterns lets you prioritize content optimization for the AI sources driving the highest-quality traffic to your highest-value pages.
| Metric | What It Measures | Tracking Frequency | Recommended Tools |
|---|---|---|---|
| Brand Citation Frequency | How often AI systems mention your brand | Daily automated, weekly manual review | Ottimo, Profound, manual queries |
| AI Overview Impression Share | % of relevant queries showing your content | Weekly | Semrush, Ahrefs AI tracking, manual audit |
| Content Freshness Score | Currency of your priority content | Weekly | CMS reporting, custom dashboard |
| Sentiment & Framing | How your brand is described | Weekly spot-checks | Manual review, AI sentiment tools |
| Competitor Benchmarking | Your share vs. competitors | Weekly | Manual queries, competitive tracking tools |
| AI Referral Quality | Traffic and conversion from AI sources | Weekly | GA4 with custom segments |
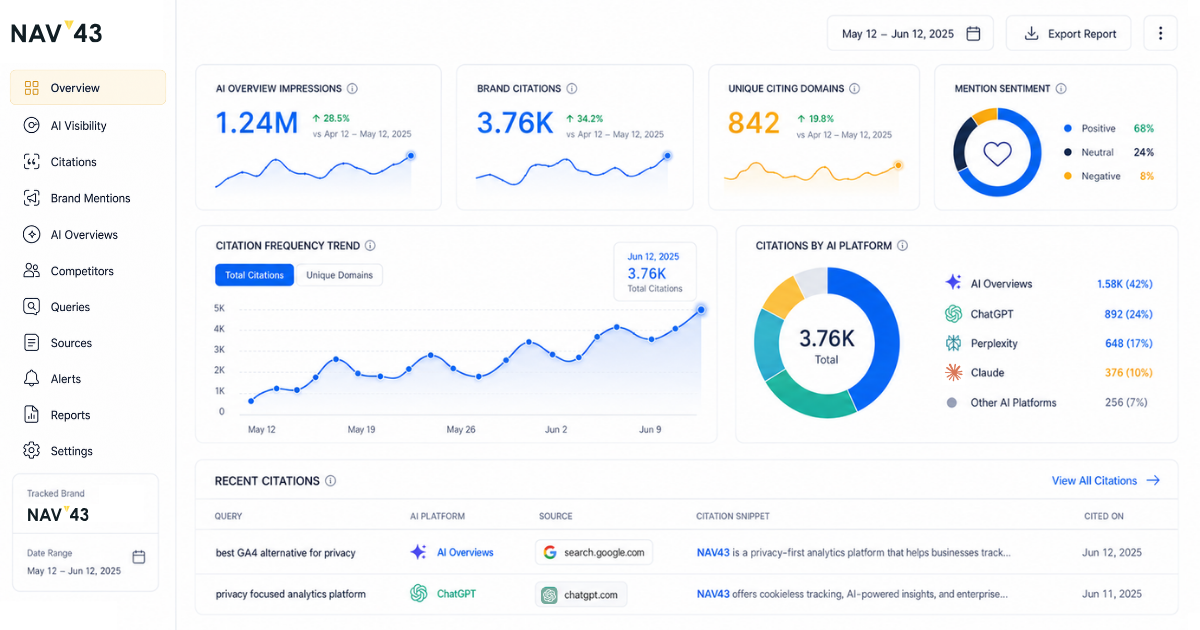
The NAV43 Weekly AI Visibility Tracking Framework
This is the exact framework we use with clients at NAV43. The insight that drove its development: AI visibility changes faster than traditional search. Weekly tracking is the minimum viable cadence. Monthly reviews miss too much movement. By the time you spot a problem, you’ve lost four weeks of potential citations.
The 30% visibility retention stat (AirOps, 2025-2026) means that without active monitoring, you can lose citations and never realize it happened until revenue impact surfaces months later.
Day 1: Automated Data Collection
Start your week with clean data. Set up automated reports to arrive Monday morning before your AI visibility review.
Automated pulls to configure:
- GA4 AI referral traffic segment (ChatGPT, Perplexity, Copilot, Gemini sessions)
- Google Search Console impressions and clicks for priority keywords
- Rank tracking data for AI Overview: prevalent keywords
- Content freshness report from your CMS (last modified dates)
- Competitor rank movements from your SEO platform
The goal is zero manual data gathering on Day 1. Everything should be pre-pulled and ready for analysis. Most teams waste 2–3 hours collecting data before they can start analyzing it. Eliminate that waste entirely.
If you’re using Looker Studio or a similar tool, build a single dashboard view that combines these sources. One screen, all the data you need, ready when you arrive.
Day 2: Citation and Mention Audit
This is the highest-value manual work in the process. You cannot fully automate AI citation tracking. The platforms change their responses too dynamically, and the nuance of how you’re described requires human evaluation.
Day 2 workflow (45–60 minutes):
- Run your top 20–30 priority queries across ChatGPT, Perplexity, and Google AI Mode
- Document new citations gained since last week
- Document citations have been lost since last week
- Note any sentiment or framing changes (positive to neutral, neutral to qualified, etc.)
- Run the same queries against competitors and log their movements
- Update your citation tracking spreadsheet
The pattern recognition from weekly citation audits compounds over time. After 6–8 weeks, you’ll start seeing correlations between content changes and citation outcomes that inform your strategy.
One of our e-commerce clients discovered through this weekly audit that a competitor was being cited for a product category query they dominated in traditional search. The competitor had published a structured comparison page with schema markup that exactly matched the query intent. We identified the content gap and published a similar page that earned AI citations within three weeks.
Day 3: Content Freshness Review
Run your freshness score calculation on the top 50 pages in your AI citation funnel. These are the pages you most want AI systems to cite: your pillar content, comparison guides, methodology explainers, and authoritative resources.
Day 3 workflow:
- Pull last-modified dates for all priority pages
- Flag any pages in “yellow zone” (31–60 days since update)
- Flag any pages in “red zone” (60+ days since update)
- Check if flagged pages have recently lost citations (correlation analysis)
- Queue content updates for at-risk pages
- Connect the refresh queue to the editorial calendar for the following week
The 60-day threshold isn’t arbitrary. It’s where the data shows citation probability starts declining (BrightEdge, 2025). Catching pages before they cross this threshold means proactive optimization rather than reactive recovery.
For pages approaching the threshold, even modest updates help: adding a new statistic, updating a section header, incorporating recent examples, or expanding a thin section.
Day 4: Competitive Response Planning
Day 4 translates observation into action. You’ve collected data, audited citations, and reviewed freshness. Now you prioritize what to do about it.
Day 4 workflow:
- Review competitor citation wins from the Day 2 audit
- Identify content topics where competitors are getting cited, and you have no content
- Identify content topics where competitors are getting cited, and you have content, but it’s not being cited
- Prioritize content creation based on opportunity size (search volume × conversion potential)
- Prioritize content optimization based on citation gap analysis
- Log action items with owners and deadlines for the content team
The output of Day 4 is a prioritized list: “Create content for Topic X, optimize existing content for Topic Y, add structured data to Page Z.” Specific, actionable, and connected to the competitive intelligence that justified each item.
Day 5: Reporting and Stakeholder Update
Compile your weekly AI visibility scorecard. This isn’t just internal documentation. It’s how you build organizational alignment around AI visibility as a strategic priority.
Weekly scorecard elements:
- Citation count trend (this week vs. last week vs. 4-week average)
- AI referral traffic trend with quality metrics
- Sentiment summary (any framing concerns noted)
- Competitive share of voice snapshot
- Top 3 wins to celebrate
- Top 3 concerns to address
- Action items for next week with owners
Distribute this to stakeholders: marketing leadership, content team, SEO team, and anyone accountable for search performance. The consistent weekly cadence builds awareness that AI visibility is a measured, managed channel, not a theoretical future concern.
NAV43 Weekly AI Visibility Cadence Checklist:
- [ ] Monday: Automated reports reviewed, data clean
- [ ] Tuesday: Top 30 queries audited across AI platforms (45–60 min)
- [ ] Wednesday: Freshness score calculated, at-risk pages queued
- [ ] Thursday: Competitive gaps identified, content priorities set
- [ ] Friday: Scorecard compiled and distributed, next week planned
Integrating AI Visibility into Your Existing SEO Dashboard
You don’t need to build an entirely separate system. AI visibility tracking should integrate with your existing SEO workflows, adding a layer of insight rather than creating parallel processes.
GA4 Configuration for AI Referral Tracking
Start with proper segmentation in Google Analytics 4. Create a custom segment for AI referral traffic:
Step-by-step GA4 setup:
- Navigate to Admin → Data Display → Segments
- Create new segment with condition: Source matches regex
chat\.openai\.com|perplexity\.ai|copilot\.microsoft\.com|gemini\.google\.com - Name it “AI Referral Traffic” and save
- Apply this segment to your standard reports
For UTM parameter tracking, implement consistent tagging for content you expect AI systems to cite. This won’t capture all AI referrals (users don’t always click through), but it provides cleaner attribution for clicks that do occur.
Custom channel grouping setup:
- Navigate to Admin → Data Display → Channel Groups
- Create custom channel: “AI Search”
- Define rules for ChatGPT, Perplexity, Copilot, Gemini sources
- This separates AI referrals from generic “Organic Search” in your default reports
Connect this to conversion tracking. Set up GA4 conversions for your key actions (demo requests, purchases, downloads) and monitor the conversion rate specifically for the AI referral segment compared to other channels. The 14.2% benchmark (Exposure Ninja) provides context, but your specific numbers matter.
Adding AI Metrics to SEMrush/Ahrefs Workflows
Traditional SEO platforms are catching up to AI visibility tracking, but they’re not there yet. Here’s how to bridge the gap:
What traditional tools can track:
- Keywords that trigger AI Overviews (both platforms now flag this)
- Ranking positions within the AI Overview source lists
- Competitor domain authority signals that correlate with citations
- Content performance metrics that suggest AI-readiness
What requires complementary tools:
- Actual citation tracking across ChatGPT, Perplexity, and other LLMs
- Sentiment analysis of how brands are described
- Cross-platform citation comparison
For unified reporting, we recommend building a Looker Studio dashboard that pulls from multiple sources: GA4 for traffic and conversion data, GSC for search performance data, your SEO platform for competitive and ranking data, and manual input or API connections for citation tracking data.
| Tool | What It Tracks | AI Visibility Capability | Integration Notes |
|---|---|---|---|
| GA4 | Traffic, conversions, engagement | Requires custom segments for AI referrals | Native connection to Looker Studio |
| SEMrush | Rankings, keywords, competitors | AI Overview flagging, limited citation tracking | API available for dashboards |
| Ahrefs | Backlinks, keywords, competitors | AI Overview flagging | API available for dashboards |
| Profound | AI citations across platforms | Purpose-built for LLM visibility | Export to dashboards |
| Manual audit | Citation quality, sentiment | Highest accuracy, not scalable | Weekly input to tracking sheet |
B2B-Specific Dashboard Customizations
B2B buying journeys have unique characteristics that demand specialized AI visibility tracking. The research phase is longer, more people are involved, and the stakes of each decision are higher.
Tracking AI Visibility Across the B2B Funnel
AI visibility matters differently at each stage of the B2B buyer’s journey. Your dashboard should reflect this.
Awareness stage metrics:
- Citations for problem/symptom queries (“what causes X problem”)
- Visibility in category education content (“what is Y methodology”)
- Brand mentions in industry overview queries
Consideration stage metrics:
- Citations in comparison queries (“A vs B vs C”)
- Visibility in solution evaluation queries (“how to choose X”)
- Inclusion in recommended vendor lists
Decision stage metrics:
- Citations in brand-specific queries (“is [Brand] good for…”)
- Visibility in implementation and pricing discussions
- Reviews and case study citations
Segment your tracking by funnel stage. A client might dominate awareness-stage queries but disappear at the comparison stage. That’s a critical gap to address.
For account-based tracking, monitor whether queries aligned with your target accounts’ language and use cases show your content. If you’re targeting enterprise healthcare companies, are you visible when AI systems are asked about enterprise healthcare solutions?
Connect this to your CRM when possible. If a closed deal came from a company whose employees likely searched AI platforms about your category, that’s attribution data worth capturing, even if it’s estimated rather than perfectly tracked.
The Trust Factor: Addressing B2B Buyer AI Skepticism
Here’s a nuance most AI visibility articles miss: 19–20% of B2B buyers report less confidence when using AI due to concerns about accuracy (Forrester, 2025). They’re using AI for research, but they’re skeptical of what it tells them.
This creates an opportunity. Brands that become trusted AI-cited sources (consistently accurate, consistently authoritative, consistently balanced) gain disproportionate influence with skeptical buyers.
Track not just whether you’re cited, but whether you’re presented as authoritative:
- Are you cited with qualifiers like “according to industry experts at…”?
- Are you cited alongside third-party validation (awards, media mentions, analyst coverage)?
- Are you cited as a primary source or just one of many options?
Third-party validation matters more in AI answers than in traditional search results. AI systems triangulate trustworthiness from multiple sources. Getting mentioned in industry publications, earning analyst coverage, and building genuine thought leadership all increase your citation authority.
B2B Dashboard Must-Haves:
- [ ] Funnel-stage segmentation for citation tracking
- [ ] Target account query monitoring
- [ ] Authority indicator tracking (primary source vs. listed option)
- [ ] Third-party mention correlation
- [ ] CRM integration for attribution modeling
Connecting AI Visibility to Revenue: The Attribution Framework
The biggest gap in most AI visibility discussions is the lack of a clear connection to business outcomes. Tracking citations feels good, but leadership cares about pipeline and revenue.
The AI Visibility Influence Model
Direct attribution for AI visibility is inherently messy. Most AI-influenced conversions don’t arrive via tracked clicks. A prospect asks ChatGPT about your category, gets your brand mentioned, then goes directly to your website by typing your URL. That looks like “direct” traffic in GA4, but it was AI-influenced.
We use a three-tier model:
AI-attributed conversions: User clicked through from an AI platform and converted in the same session. This is trackable with proper GA4 segments. It’s the smallest bucket but the most defensible attribution.
AI-assisted conversions: User arrived from an AI referral, didn’t convert immediately, but converted within 30 days. GA4’s path analysis and conversion path reports surface this. It requires configuring your lookback window appropriately.
AI-influenced conversions (estimated): User was likely exposed to AI content about your brand before converting via other channels. This requires survey-based validation.
Implement post-purchase or post-demo surveys that include AI platforms as discovery options:
- “How did you first learn about [Brand]?”
- Include: “AI assistant (ChatGPT, Perplexity, etc.)” as an option
Even a 10–15% response rate provides directional data on AI’s role in your pipeline. Over time, this builds confidence in influence estimates.
Building Your AI ROI Calculation
Practical formula for estimating AI visibility ROI:
Monthly AI-Influenced Pipeline = (Estimated AI-Influenced Traffic) × (Conversion Rate) × (Average Deal Value)
Where:
- Estimated AI-Influenced Traffic = Direct AI referrals (from GA4) + Estimated undercounted visits (multiplier based on survey data)
- Conversion Rate = Your standard visitor-to-opportunity conversion rate (or AI-specific if you have enough data)
- Average Deal Value = Your typical closed-won deal
Example calculation:
- GA4 shows 500 AI referral visits/month
- Survey data suggests AI exposure for an additional 2,000 visitors who arrived “direct” (conservative 1.5x multiplier)
- Total AI-influenced visits: 750
- Conversion rate: 3%
- Opportunities: 22.5
- Average deal value: $50,000
- Monthly AI-influenced pipeline: $1.125M
This is an estimate, not precise accounting. The value is in tracking improvement over time. If your citation frequency increases 40% and the AI-influenced pipeline estimate increases 35%, you’re validating the connection.
NAV43 AI Visibility ROI Calculator:
| Input | Your Numbers |
|---|---|
| Monthly AI referral visits (GA4) | ___ |
| Multiplier for untracked exposure (1.5x–3x based on survey) | ___ |
| Estimated AI-influenced visits | ___ |
| Visitor-to-opportunity rate | ___ |
| Estimated AI-influenced opportunities | ___ |
| Average deal value | $___ |
| Estimated Monthly AI-Influenced Pipeline | $___ |
Common Pitfalls When Building Your AI Visibility Dashboard
Pitfall 1: Tracking Only One AI Platform
The 87.4% ChatGPT dominance in referral traffic is misleading for dashboard design. Other platforms matter for specific audiences, particularly in B2B where decision-makers may use Perplexity Pro, Copilot in Microsoft 365, or Gemini in Google Workspace.
The 615x variance between platforms for the same brand means your ChatGPT visibility tells you nothing about your Perplexity visibility. Track at minimum: ChatGPT, Google AI Overviews, Perplexity, and Microsoft Copilot. Add Claude and Gemini if your audience skews technical.
Pitfall 2: Measuring Visibility Without Sentiment
We’ve seen brands celebrate citation counts while being systematically described with qualifiers like “but users report concerns about…” or “considered entry-level compared to…”
Being cited negatively is worse than not being cited at all. It reinforces unfavorable positioning with every AI response. Build sentiment tracking into your weekly audit. Even 15 minutes of manual spot-checking catches framing issues before they compound.
Pitfall 3: Ignoring Content Freshness Decay
The 60-day freshness window (BrightEdge, 2025) is more aggressive than most teams realize. Content that has performed well for years needs ongoing maintenance to keep AI citations up to date.
Most organizations operate on quarterly or annual content refresh cycles. That’s too slow. Pages drop from AI citation without warning, and recovery takes longer than prevention. Build freshness tracking into your weekly workflow, not your quarterly planning.
Pitfall 4: Treating AI Visibility as Separate from SEO
AI visibility and traditional SEO reinforce each other, not operate in isolation. Structured data improves both. E-E-A-T signals improve both. Content quality improves both. Sites implementing structured data and FAQ blocks saw a 44% increase in AI search citations (BrightEdge, 2025).
Build unified dashboards that show AI and traditional search performance side by side. The content optimizations that drive AI citations typically improve traditional rankings as well, and vice versa.
Pitfall 5: Expecting Immediate Results
AI visibility is a compounding game. Week 1 of tracking won’t reveal transformative insights. Week 12 will show patterns that inform strategy for the next year.
Many teams abandon tracking before patterns emerge. Commit to 90 days minimum before evaluating whether your dashboard approach is working. The brands seeing results from AI visibility optimization have been tracking long enough to understand their baseline and measure improvement.
What We’ve Seen: NAV43’s AI Visibility Tracking in Practice
Running AI visibility dashboards across multiple client accounts has revealed patterns that wouldn’t surface in isolated examples.
Pattern 1: Citation velocity matters more than citation count. A client with steady citations saw declining AI referral traffic. Weekly tracking revealed that while total citations stayed constant, new citations had dropped to zero. They were coasting on old content, getting stale. The velocity signal preceded the traffic decline by three weeks, giving us time to intervene.
Pattern 2: Competitor movements predict your citations. When a competitor publishes strong comparison content with proper structured data, your citations for related queries often drop within 2–3 weeks. Weekly competitive tracking catches these movements early, while monthly tracking discovers them after citations are already lost.
Pattern 3: Third-party mentions amplify owned content citations. Clients who earned mentions in industry publications (Forbes, G2, etc.) saw their owned content citations increase in the following weeks. AI systems seem to triangulate authority. Seeing your brand mentioned elsewhere increases trust in your owned content. This insight only emerged from correlating earned media timing with citation tracking.
The common thread: insights emerge from consistent tracking over time. A single snapshot tells you where you stand. Weekly tracking tells you where you’re heading and why.
Conclusion: Building Your AI Visibility Advantage
The shift from clicks to citations is already here. Gartner predicts traditional search engine volume will drop 25% by 2026 as buyers shift to AI chatbots, and we’re already seeing that trajectory in the data.
Brands that build AI visibility tracking systems now will have compounding advantages:
- Pattern recognition: Understanding what drives citations in your category before competitors figure it out
- Response speed: Catching citation losses and competitive movements in days rather than months
- Attribution clarity: Connecting AI visibility to the pipeline before it becomes a board-level question you can’t answer
- Content optimization: Knowing exactly which content to refresh, expand, or create based on citation data
- Competitive positioning: Monitoring and responding to competitor AI visibility movements in real time
The tools are still emerging. The best practices are still being written. That’s exactly why building your system now matters. Early movers shape the playbook; late movers follow it.
Next Steps
Week 1: Configure GA4 segments for AI referral traffic. Pull your first baseline data.
Week 2: Run your first manual citation audit across ChatGPT, Perplexity, and Google AI Mode for your top 20 queries. Document where you appear and how you’re described.
Week 3: Build your content freshness score and identify pages at risk of dropping below the 60-day threshold.
Week 4: Compile your first weekly AI visibility scorecard and share it with stakeholders. Commit to the weekly cadence.
If you want help building an AI visibility dashboard customized for your business, with proper GA4 configuration, competitive benchmarking, and attribution frameworks, request a free growth plan from NAV43. We’ll assess your current AI search visibility and show you exactly where the opportunities are.
The brands that will dominate the next era of search are building their tracking systems right now. The only question is whether you’ll be one of them.
