How to Measure Brand Visibility in ChatGPT, Perplexity & AI
Here’s a statistic that should fundamentally change how you think about AI visibility: when SparkToro ran the same brand recommendation prompt through ChatGPT 100 times, the AI gave the same list of brands in fewer than 1 out of 100 responses (SparkToro/Gumshoe Research, 2026). Read that again. There’s less than a 1% chance that any two AI responses will recommend the same brands.
This isn’t a bug. This is how large language models work. They’re probabilistic systems, not deterministic databases. And if you’re trying to measure your brand’s visibility in AI search the same way you track Google rankings, you’re fundamentally measuring wrong.
The stakes couldn’t be higher. According to Forrester, 89% of B2B buyers now use generative AI as a key source of self-guided information throughout their purchasing journey (Forrester, 2025). ChatGPT processes 2.5 billion prompts daily with over 700-800 million weekly active users (OpenAI/Exploding Topics, 2025). Google AI Overviews now reach 2 billion monthly users across 200+ countries (Google/TechCrunch, 2025). Your brand is either being recommended in these conversations, or it isn’t. And right now, you probably have no idea which.
I’ve spent the last eighteen months working with enterprise and e-commerce clients to solve this exact problem. Most marketers are trying to apply SEO rank-tracking logic to a system that doesn’t have ranks. They’re checking their “position” in ChatGPT once, seeing they’re mentioned, and assuming everything is fine. They’re wrong.
This article gives you the exact framework NAV43 uses to measure AI visibility. It’s built for the probabilistic nature of LLM responses, not the deterministic world of position 1-10. You’ll learn the four metrics that actually matter, how to achieve statistically valid measurements (hint: you need 60-100 runs per prompt), tool selection by budget, and a quarterly reporting framework you can implement starting this week.
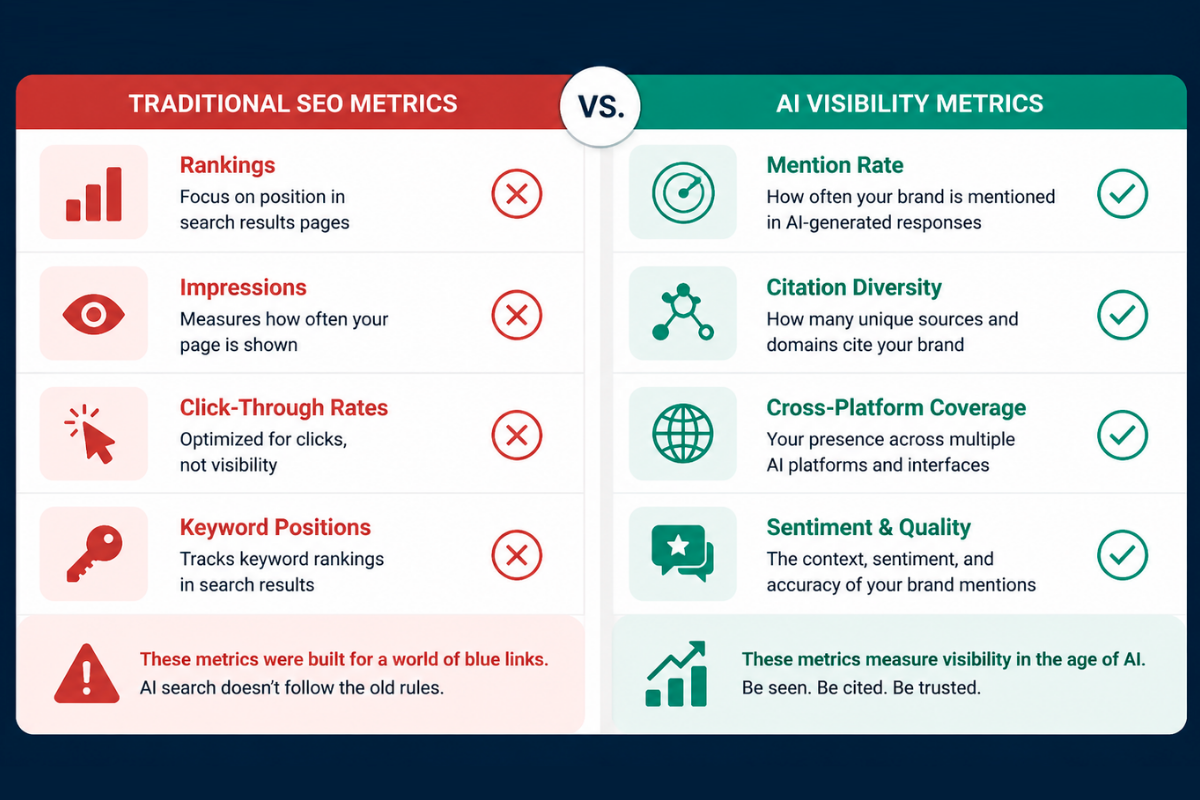
Why Traditional SEO Metrics Don’t Work for AI Visibility
Let me paint you a picture. In traditional Google search, you could check your ranking for a keyword, see that you’re in position 3, and plan your optimization strategy accordingly. That position might fluctuate by a few spots, but the system was fundamentally deterministic. Position 1 was position 1.
AI search doesn’t work this way. At all.
When Ahrefs analyzed AI Overview responses, they found that content changes 70% of the time for the exact same query, with 45.5% of citations being replaced with entirely new sources between responses (Ahrefs, 2025). This isn’t volatility in the traditional sense. This is the baseline behavior of these systems.
You don’t “rank #1” in ChatGPT. You have a probability of being mentioned. That probability fluctuates based on prompt phrasing, model updates, conversation context, and the inherent randomness built into LLM inference. Checking your ChatGPT “position” once tells you absolutely nothing about your actual visibility.
The zero-click reality makes this even more critical. Over 70% of searches now end without a click to any website (Industry research, 2025). Gartner predicts traditional search engine volume will drop 25% by 2026 due to AI chatbots and virtual agents (Gartner, 2024). The value of AI visibility isn’t traffic in the traditional sense. It’s brand awareness and recommendation at the moment of decision.
The Rank Tracking Fallacy
Most “AI SEO tools” entering the market are simply applying old metrics to a new medium. They’ll tell you that you appeared in position 2 of a ChatGPT response. Great. Run that same prompt again, and you might be in position 4. Run it ten more times, and you might not appear at all.
Single-point measurements in a probabilistic system are statistical noise, not data. If you’re making strategic decisions based on whether you showed up in one AI query, you’re guessing. We need a fundamentally different approach.
The Four Metrics That Actually Matter for AI Brand Visibility
Forget position. Forget ranking. In the world of AI search visibility, we need to think in terms of probability and distribution.
After working with dozens of enterprise clients on this challenge, NAV43 has developed a four-metric framework that captures what actually matters for AI visibility measurement. These metrics are designed for probabilistic systems and give you actionable intelligence you can use to improve your presence.
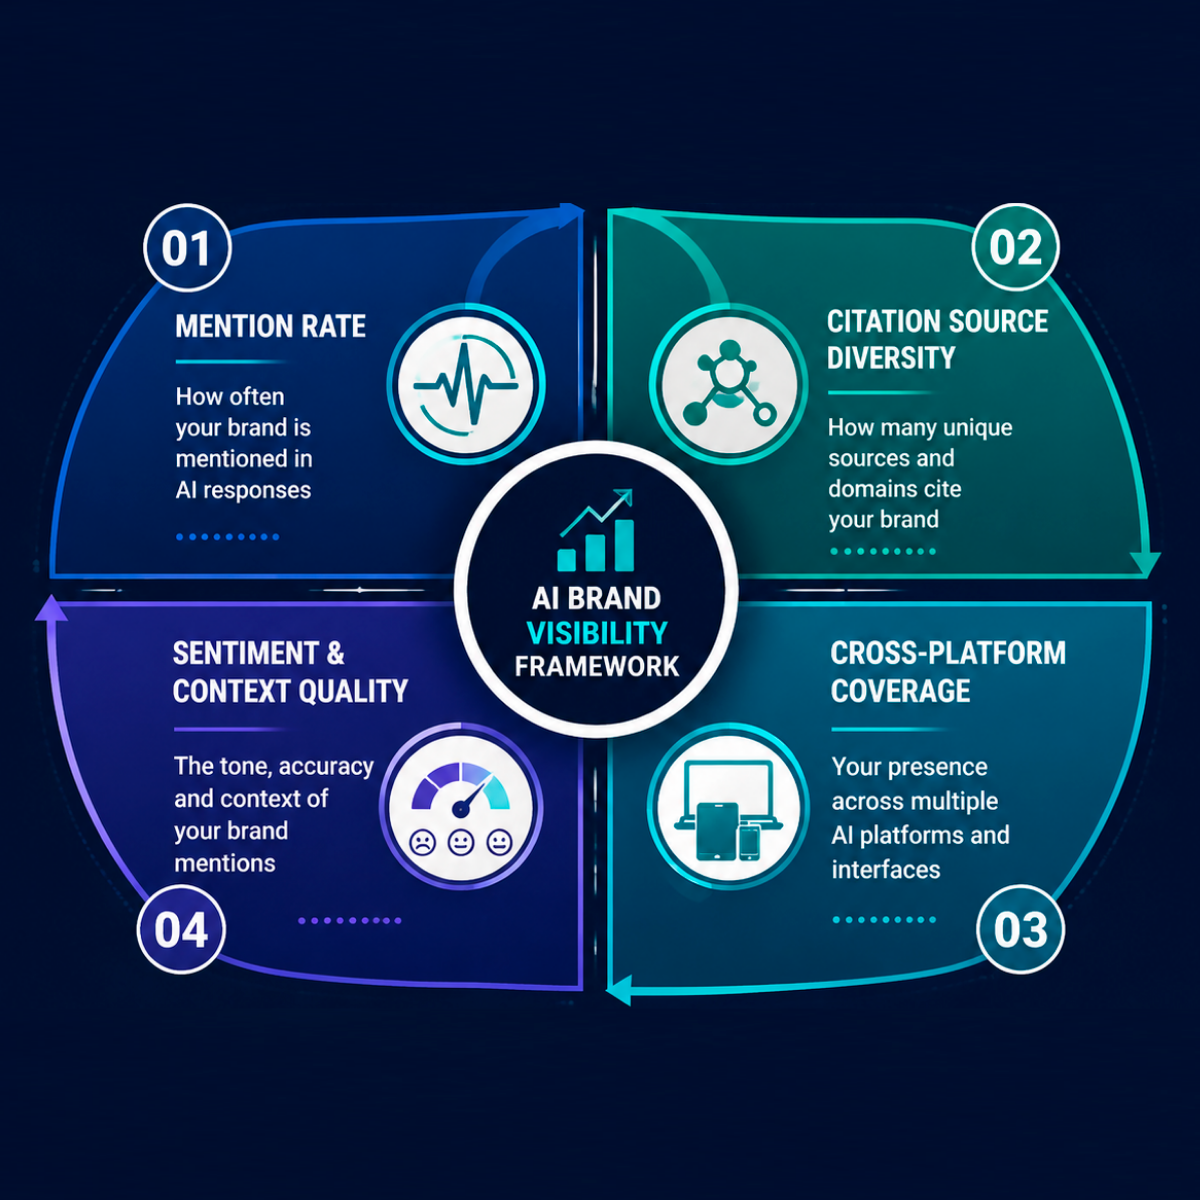
Metric 1: Mention Rate (Frequency Probability)
Definition: Out of X prompts related to your category, what percentage mention your brand?
This is your “share of voice” in AI search. If you’re mentioned in 35% of relevant prompts while your top competitor appears in 67%, you have a clear visibility gap to close.
Mention rate is the most foundational metric because it answers the simplest question: when prospects ask AI about your category, how often does your brand come up?
To measure this accurately, you need to run the same or similar prompts multiple times. Based on SparkToro’s research showing less than 1% consistency across runs, NAV43 recommends a minimum of 60-100 runs per core prompt to achieve statistical validity (SparkToro/Gumshoe Research, 2026). Five or ten spot checks tell you nothing reliable.
Here’s a real example of why this matters. One of our B2B SaaS clients ran 100 prompts for their primary use case and found they were mentioned in only 12% of responses. Their top competitor? 67%. That’s not a small gap. That’s a five-to-one disadvantage in AI visibility that they had no idea existed until they measured properly.
AirOps research confirms this challenge at scale. Only 30% of brands remain visible from one AI answer to the next (AirOps, 2026). Consistency is rare, which is exactly why measuring probability through volume is essential.
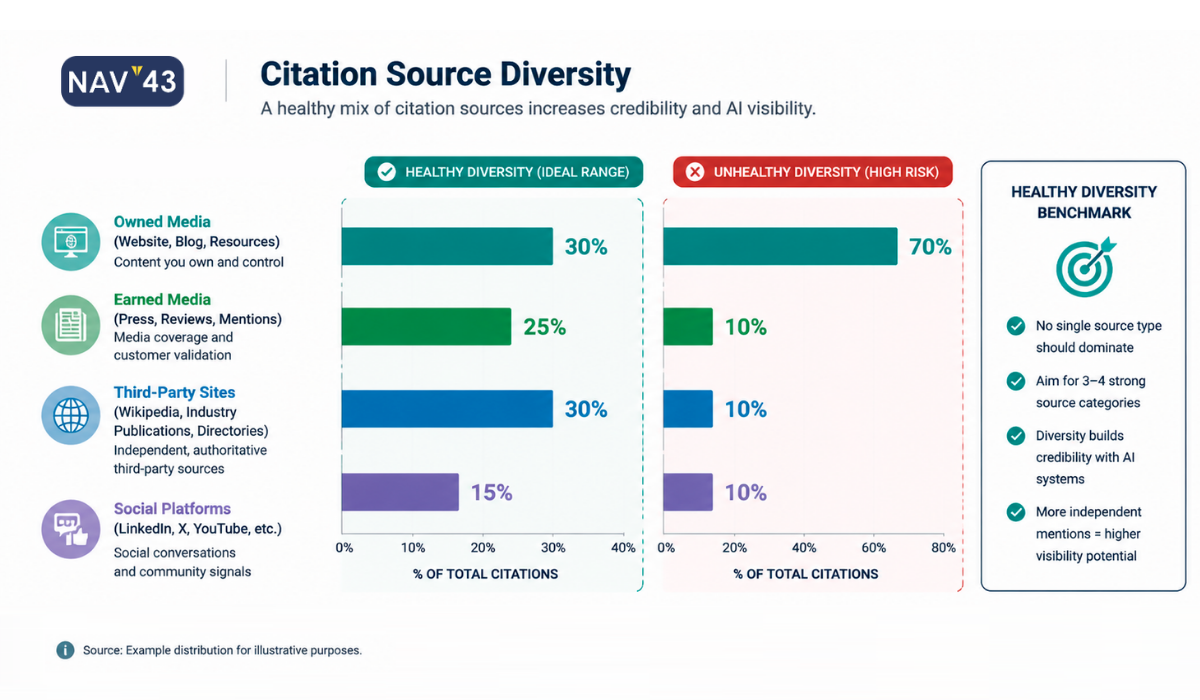
Metric 2: Citation Source Diversity
Definition: When AI systems cite sources to justify mentioning your brand, where are those citations coming from?
This metric tracks the distribution of citation sources across four categories: your owned domain, earned media (press coverage, reviews), community mentions (Reddit, forums, Quora), and industry publications (analyst reports, trade publications).
Here’s why this matters: according to AirOps research, brands are 6.5x more likely to be cited in AI responses via third-party sources than on their own domains (AirOps, 2025). If all your AI citations come from a single source, your visibility is fragile. One algorithm update or source de-prioritization could eliminate your presence entirely.
This creates what I call the third-party paradox. To win AI visibility, you need a strong off-site presence. PR coverage, customer reviews, Reddit discussions, and mentions by industry analysts. This isn’t SEO as usual, where optimizing your own pages was the primary lever. AI visibility requires an integrated earned media strategy.
Citation Source Diversity Framework
| Category | Examples | Why It Matters |
|---|---|---|
| Owned | Your website, blog, documentation | Direct control, but LLMs prefer third-party validation |
| Earned | Press coverage, review sites, G2/Capterra | High trust signal, major citation driver |
| Community | Reddit, Quora, industry forums | Real user discussions carry authenticity weight |
| Industry | Analyst reports, trade publications | Authority signals for B2B categories |
When tracking citation source diversity, aim for meaningful presence across at least three of these four categories. Over-reliance on any single category creates risk.
Metric 3: Cross-Platform Coverage
Definition: Is your brand visible across ChatGPT, Perplexity, and Google AI Overviews? Or are you dominant on one platform while invisible on others?
This metric matters because your buyers don’t limit themselves to one AI tool. ChatGPT accounts for approximately 79% of global generative AI web traffic as of January 2026 (Similarweb, 2026), leaving 21% across other platforms. Perplexity is gaining significant enterprise traction. Google AI Overviews reach 2 billion monthly users (Google/TechCrunch, 2025).
Each platform pulls from different data sources, weights different signals, and updates at different cadences. I’ve seen clients who are cited heavily in ChatGPT but completely invisible in Perplexity. If their buyers prefer Perplexity, all that ChatGPT visibility is worthless.
The solution is to track mention rates separately per platform, then create a coverage score across all three. At NAV43, we use a weighted composite based on platform relevance to each client’s specific audience. A B2B enterprise software company might place greater weight on Perplexity due to its research-focused user base, while a consumer brand might place greater weight on ChatGPT for volume.
Metric 4: Sentiment and Context Quality
Definition: When you ARE mentioned, is the mention positive? Neutral? In the wrong context entirely?
Being cited as “an option to avoid” or “historically had problems with X” is worse than not being cited at all. AI systems synthesize information from many sources, and if there’s negative content about your brand anywhere in their training data, it can surface.
This metric requires reviewing AI responses to categorize mentions as:
– Positive recommendation: Brand is suggested as a solution
– Neutral mention: Brand is listed without a clear recommendation
– Negative/cautionary: Brand mentioned with caveats or warnings
– Wrong context: Brand mentioned for use cases you don’t serve
I had a client discover that ChatGPT cited a three-year-old negative review in 40% of its mentions. They had no idea until they started measuring sentiment systematically. The source of the problem? A scathing Reddit thread from a former employee that had been indexed and was being weighted heavily in certain query contexts.
Unlike traditional SEO, where you control your own pages, AI systems synthesize a narrative from across the web. Your brand story is being written by the aggregation of all content about you. Measuring sentiment tells you what story is actually being told.
The NAV43 AI Visibility Measurement Framework
Now that we’ve established what to measure, let’s get into how to measure it. This is the proprietary framework that NAV43 uses with enterprise clients, and it addresses the statistical validity problem most marketers ignore.
The framework has three phases: Prompt Design, Sampling Methodology, and Reporting Cadence. Each phase is essential. Skip any one, and your measurement program falls apart.
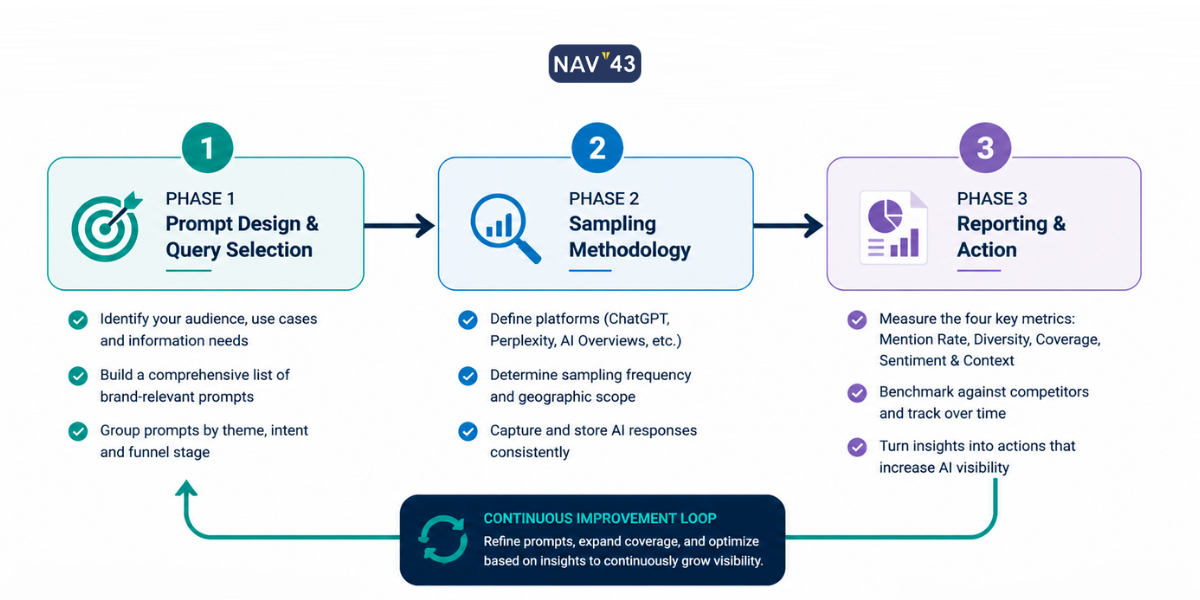
Phase 1: Prompt Design and Query Selection
Start with your buyer’s questions, not your keywords.
This is a fundamental shift from traditional SEO keyword research. You’re not optimizing for search volume. You’re anticipating how real prospects will phrase questions to an AI assistant during their research process.
Create prompt categories aligned to the buyer’s journey:
Awareness-stage prompts:
– “What are the best [category] tools for [use case]?”
– “Who are the leading [category] vendors?”
– “What should I consider when evaluating [category] solutions?”
Consideration-stage prompts:
– “Compare [Brand A] vs [Brand B] for [specific need]”
– “What are the pros and cons of [specific tool]?”
– “Which [category] solution is best for [company size/industry]?”
Decision-stage prompts:
– “Is [Your Brand] good for [specific use case]?”
– “What do customers say about [Your Brand]?”
– “[Your Brand] review for [industry/company type]”
Include prompt variations. AI responses vary dramatically based on exact phrasing. “Best CRM for mid-market B2B” will yield different results than “top CRM tools for growing B2B companies.” Same intent, different outputs.
Prompt Design Template for AI Visibility Measurement
| Stage | Core Prompt | Variation 1 | Variation 2 | Variation 3 |
|---|---|---|---|---|
| Awareness | What are the best [category] tools? | Who are the leading [category] vendors? | Top [category] solutions in 2026 | Recommended [category] for [use case] |
| Consideration | Compare [Brand A] vs [Brand B] | [Brand A] alternatives | Pros and cons of [Brand A] | [Brand A] vs competitors |
| Decision | Is [Your Brand] good for [use case]? | [Your Brand] reviews | Should I use [Your Brand]? | [Your Brand] for [industry] |
NAV43 recommends 10-20 core prompts per product or service line, with 3-5 variations each. That gives you 30-100 prompt variants to track, providing comprehensive coverage of how buyers actually ask about your category.
Phase 2: Sampling Methodology for Statistical Validity
Here’s the critical insight most AI visibility guides ignore: you need 60-100 runs per prompt for statistically valid data.
SparkToro’s research proved that with less than 1% consistency across runs, a sample size of 5-10 tells you nothing meaningful (SparkToro/Gumshoe Research, 2026). You need enough data points to establish probability distributions, not just anecdotes.
The math is simple: If there’s less than 1% chance of getting the same response twice (SparkToro/Gumshoe Research, 2026), you need volume to identify patterns. Running a prompt 5 times and seeing your brand mentioned 2 times doesn’t mean you have 40% visibility. Your confidence interval is so wide that the true rate could be anywhere from 5% to 75%.
At 100 runs, you have much tighter confidence intervals. If you’re mentioned in 35 out of 100 runs, you can be reasonably confident your actual mention rate is in the 25-45% range.
Practical implementation:
1. Run each core prompt 60-100 times across each platform (ChatGPT, Perplexity, Google AI Overviews)
2. Record every response in a structured format
3. Calculate mention rate, citation sources, and sentiment for each prompt
4. Aggregate across prompt categories for stage-level visibility metrics
This is where dedicated AI visibility tools pay for themselves. Manual sampling at this scale is prohibitive for anything beyond a pilot program. If you’re running 50 prompts at 100 runs each across 3 platforms, that’s 15,000 individual queries. You need automation.
Sampling Requirements by Use Case
| Use Case | Frequency | Runs per Prompt | Platforms |
|---|---|---|---|
| Competitive monitoring | Weekly to Monthly | 100 | All 3 |
| Category visibility | Monthly | 60 | All 3 |
| Brand sentiment | Quarterly | 60 | ChatGPT + Perplexity |
| New product launch | Weekly (first 8 weeks) | 100 | All 3 |
Phase 3: Reporting and Action Cadence
Measurement without action is just expensive curiosity. Here’s how to structure your reporting cadence to drive actual improvements.
Weekly: Quick visibility pulse. Are you trending up or down across platforms? Flag any sudden drops that might indicate a model update or new competitive content. This is a 15-minute check-in, not a deep dive.
Monthly: Full metric review across all four dimensions. Compare with the previous month and with competitors. Identify specific prompts where you’re underperforming and prioritize content actions. This should inform your content calendar for the following month.
Quarterly: Strategic review including content freshness audit (pages not updated in 90+ days are at risk), source diversity assessment, and platform coverage gaps. This is where you adjust your overall GEO strategy.
AirOps research found that pages not updated at least quarterly are 3x more likely to lose their AI citations (AirOps, 2026). Build content refresh triggers directly into your quarterly reporting. If a page that drives significant AI visibility hasn’t been updated in 90 days, it is automatically added to the refresh list.
What to report to leadership:
– Mention rate trend (this month vs. last month, this quarter vs. last quarter)
– Competitor gap (your mention rate vs. top 3 competitors)
– Source diversity health score (are you over-reliant on any single source type?)
– Top 3 action items for the next period
NAV43 Quarterly AI Visibility Report Checklist
- [ ] Mention rate by platform (ChatGPT, Perplexity, AI Overviews)
- [ ] Mention rate by buyer stage (awareness, consideration, decision)
- [ ] Competitor benchmark comparison
- [ ] Citation source diversity breakdown
- [ ] Sentiment analysis summary (positive/neutral/negative %)
- [ ] Content freshness audit (pages >90 days since update)
- [ ] Top-performing content assets for AI visibility
- [ ] Content gaps identified through competitor citations
- [ ] Priority action items for next quarter
Tool Selection by Budget and Maturity
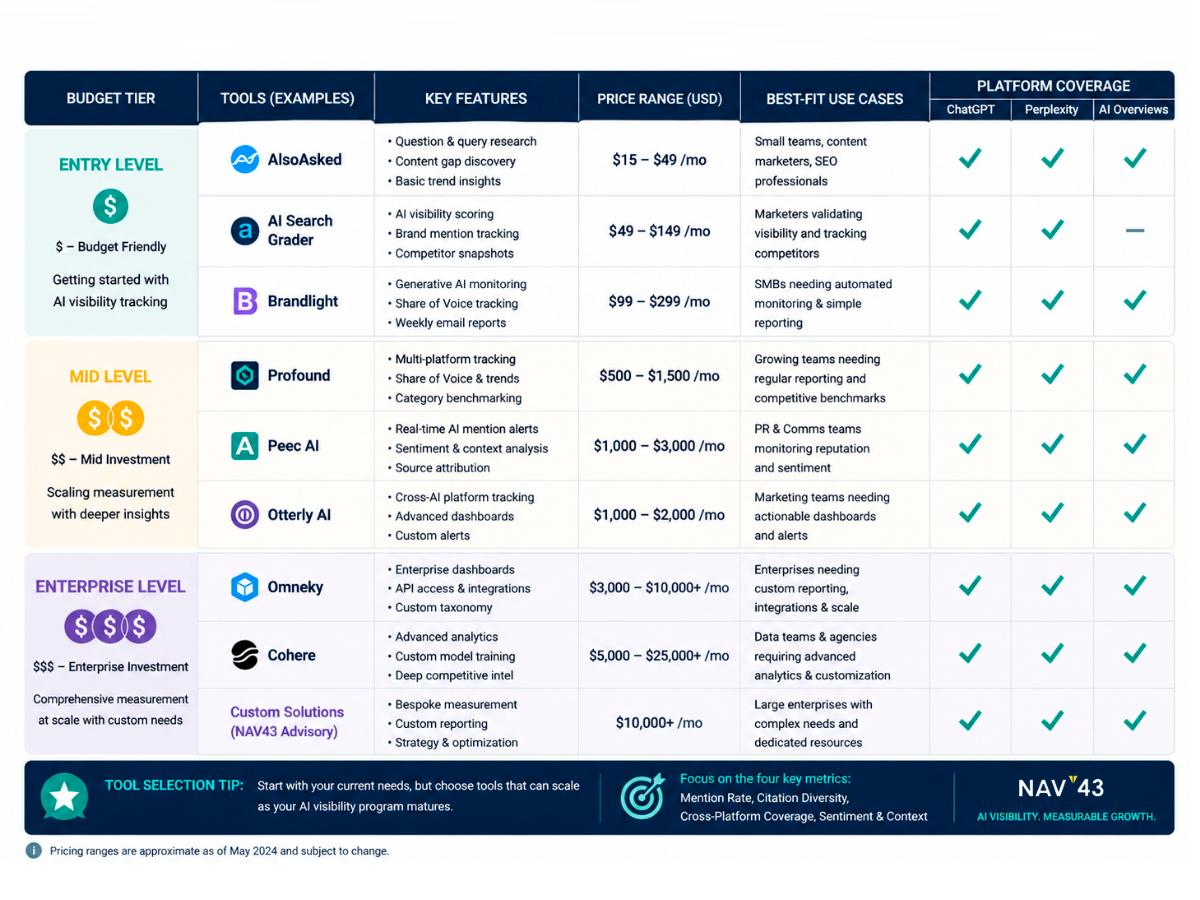
The AI visibility tool landscape is fragmented and maturing rapidly. Over 30 tools now exist in this space, with major SEO platforms like Semrush, Ahrefs, and SE Ranking adding AI tracking features to their suites.
Rather than doing a feature-by-feature comparison, which would be outdated within months, let me organize recommendations by budget tier. Most tools are still maturing, and your choice should be based on what you can realistically implement and maintain.
Free and Low-Cost Options ($0-$50/month)
Manual sampling remains viable for organizations testing the concept. Run prompts yourself, record responses in a structured spreadsheet, and calculate metrics manually. Time-intensive but free.
For a starting template, create a Google Sheet with columns for date, platform, prompt, your brand mentioned (Y/N), position in response, cited sources, and sentiment (positive/neutral/negative). Run 10-20 prompts daily across platforms for a month to establish baseline metrics.
OpenLens offers basic AI mention tracking at no cost. Good for getting started and understanding what automated tracking looks like.
Limitations at this tier: manual effort requirements, limited automation, and difficulty achieving statistical validity at the 60-100 runs scale.
Best for: Early-stage companies testing the concept before committing budget, agencies building initial case studies to prove value to clients.
Mid-Market Tools ($50-$500/month)
Peec AI, Otterly.AI, and SE Ranking AI Toolkit are purpose-built for AI visibility tracking. These tools automate prompt monitoring across platforms, provide cross-platform coverage reports, and include basic citation tracking.
Features at this tier typically include:
– Automated scheduled monitoring of configured prompts
– Cross-platform tracking (ChatGPT, Perplexity, some AI Overviews coverage)
– Basic mention rate trending over time
– Competitor comparison capabilities
Limitations: May not support the 60-100 run sampling needed for full statistical validity. Limited API access for custom reporting. Integration with existing MarTech stacks can be clunky.
Best for: Growth-stage companies with dedicated marketing ops resources, agencies serving mid-market clients who need to demonstrate AI visibility as part of their service offering.
Enterprise Solutions ($500+/month)
Profound, Brandwatch (AI features), and integrated SEO suites with AI modules offer capabilities required for enterprise-scale programs.
Features at this tier include:
– High-volume sampling meeting statistical validity requirements
– API integrations with existing MarTech stacks
– Competitor benchmarking at scale
– Sentiment analysis and brand narrative monitoring
– Custom reporting and executive dashboards
– Dedicated support and implementation assistance
Budget context: Enterprise GEO programs typically run $75K-$250K+ annually when including tools, content production, and agency support. The GEO market is projected to grow from $848M in 2025 to $19.8B by 2034, reflecting how seriously enterprises are taking this channel.
Best for: Enterprise brands where AI visibility directly impacts pipeline, companies in competitive categories where marginal visibility gains have a material revenue impact, and organizations needing integration with existing enterprise reporting infrastructure.
Tool Tier Comparison Summary
| Tier | Monthly Cost | Key Features | Limitations | Best For |
|---|---|---|---|---|
| Free/Low-Cost | $0-$50 | Manual tracking, basic automation | Time-intensive, limited validity | Testing concept, small teams |
| Mid-Market | $50-$500 | Automated monitoring, cross-platform | May lack sampling depth, limited integration | Growth-stage, agencies |
| Enterprise | $500+ | Full sampling, API, benchmarking | Cost, implementation complexity | Enterprise brands, competitive categories |
Building the Business Case: ROI of AI Visibility Measurement
I hear this question constantly: “Is this worth measuring if AI traffic is still a small percentage of our total?”
Let me address the skeptic directly.
The awareness argument: AI search traffic increased 527% year-over-year between 2024 and 2025 (Semrush, 2025). Yes, it’s still less than 1% of total referral traffic for most sites. But that growth trajectory is undeniable. Companies that build measurement and optimization capabilities now will have compounding advantages as this channel scales.
The conversion argument: AI search visitors convert at 4.4x the rate of traditional organic traffic (Omnius/TripleDart, 2025). This isn’t casual browsing traffic. Users asking AI for recommendations are in active buying mode. The visitors you do get from AI referrals are substantially more valuable than average organic visitors.
The brand awareness argument: Even without direct clicks, being recommended by ChatGPT when a prospect asks “what’s the best [your category] solution?” has massive brand value. That recommendation happens at the exact moment of consideration. You can’t buy that kind of placement.
The competitive intelligence argument: 67% of Fortune 500 CMOs identified GEO as a top-three digital priority for FY2026, up from just 18% in 2024 (MarketIntelo Q4 2025 Research, 2025). Your competitors are investing in this. If you’re not measuring, you have no idea whether you’re winning or losing a channel that leadership across your industry has identified as critical.
The ROI calculation is relatively straightforward once you have a measurement in place:
- Baseline current AI visibility across the four metrics
- Identify visibility gaps versus competitors
- Implement content and PR strategies to close gaps (this connects directly to your content marketing SEO strategy)
- Track improvement in mention rates over 90-180 days
- Attribute pipeline influenced by AI-referred traffic (requires proper UTM/analytics setup)
For B2B companies with deal sizes above $50K, winning even a handful of additional opportunities through improved AI visibility easily justifies program investment.
Common Pitfalls in AI Visibility Measurement
After implementing these measurement frameworks with dozens of clients, I’ve seen the same mistakes repeated. Avoid these:
Pitfall 1: Single-check “audits.”
Running a few prompts once and drawing conclusions. This is the most common mistake, and it produces completely unreliable data. If you’re not running 60+ prompts per query, you’re guessing.
Pitfall 2: Platform tunnel vision
Measuring only ChatGPT because it has the most users. Your buyers might prefer Perplexity for research. Or they might be seeing AI Overviews in their Google searches without even realizing they’re using AI. Measure all three.
Pitfall 3: Ignoring sentiment
Celebrating that you’re “mentioned” without analyzing how you’re mentioned. Negative citations damage your brand. Context-inappropriate citations confuse prospects. Mention rate alone doesn’t tell the full story.
Pitfall 4: Static prompt sets
Using the same prompts forever. Buyer language evolves. New competitors emerge. New use cases develop. Review and update your prompt inventory quarterly.
Pitfall 5: Measurement without action
Generating reports that nobody reads or acts on. Every measurement should connect to a content or PR action. If you’re not using the data to improve visibility, stop measuring.
Pitfall 6: Expecting SEO-timeline results
Traditional SEO improvements might take 6-12 months to show results. AI visibility can change more quickly because models are updated frequently. But it can also be more volatile. Set expectations appropriately and measure trends over quarters, not days.
Integrating AI Visibility with Your Broader Search Strategy
AI visibility measurement doesn’t exist in isolation. It should connect to your overall search and content strategy.
The content that performs well for traditional SEO often performs well for AI visibility, but not always. AI systems prefer content that:
- Answers specific questions directly and quotably
- Includes structured data that AI can parse
- Has authoritative third-party citations and references
- Gets updated regularly (quarterly minimum)
- Exists within a broader context of topical authority
This aligns closely with the AI-ready content framework we’ve published previously. Content structured for AI citation naturally supports AI visibility.
Your measurement program should inform your content calendar. Prompts where you have low visibility should trigger content creation or refresh. Citation source gaps should trigger PR and earned media initiatives. Sentiment issues should trigger reputation management responses.
For the technical implementation of structured data to support AI visibility, see our guide on structured data for GEO.
Conclusion: Key Takeaways
Let me summarize what we’ve covered:
- Traditional rank tracking is meaningless for AI visibility. With less than 1% consistency across AI responses (SparkToro/Gumshoe Research, 2026), you need probability-based metrics, not position-based metrics.
- The four metrics that matter are: mention rate (frequency probability), citation source diversity, cross-platform coverage, and sentiment/context quality. Measure all four.
- Statistical validity requires volume. Run 60-100 queries per prompt to establish reliable baselines. Single-check “audits” produce unreliable data.
- Tool selection should match your maturity. Start manually or at low cost to prove the concept, then invest in automation as you scale.
- Measurement must connect to action. Every visibility gap identified should trigger a content, PR, or optimization response. Reports that don’t drive action are expensive decoration.
Next Steps
If you’re starting from zero, here’s your action plan for the next 30 days:
Week 1: Define 10-15 core prompts for the awareness, consideration, and decision stages of your primary product or service.
Week 2: Run manual sampling across ChatGPT and Perplexity (minimum of 50 runs per prompt). Record results in a structured spreadsheet.
Week 3: Calculate baseline metrics for mention rate, citation sources, and sentiment. Identify your biggest visibility gaps versus competitors.
Week 4: Prioritize 3-5 content actions to address gaps. Evaluate tool options for automating ongoing measurement.
For enterprise organizations looking to implement a comprehensive AI visibility measurement program, NAV43 offers strategic GEO assessments that include prompt design, baseline measurement, competitive benchmarking, and actionable recommendations. We’ve built these frameworks through direct client work, not theory.
The window for establishing AI visibility leadership is narrowing. Top brands are capturing a disproportionate share of AI citations, with concentration accelerating. The 2026 GenAI Brand Visibility Index showed that the top 10 digital marketing experts captured 59.5% of citability by February 2026, up from 30.9% in December 2025. That’s a 92% increase in concentration in just two months (Similarweb, 2026).
Stop guessing about your AI visibility. Start measuring. The brands that build robust measurement capabilities today will compound their advantages as AI search continues to grow exponentially.
