LinkedIn Ads Benchmarks for FinTech: The Definitive Guide for B2B Marketers in 2025
1. Executive Summary
LinkedIn advertising has become the cornerstone of B2B marketing, particularly for FinTech companies targeting enterprise buyers. In 2025, understanding realistic benchmarks isn’t just helpful; it’s essential for survival in an increasingly competitive landscape. Using LinkedIn benchmarks allows you to compare your results to industry standards and better evaluate your campaign effectiveness.
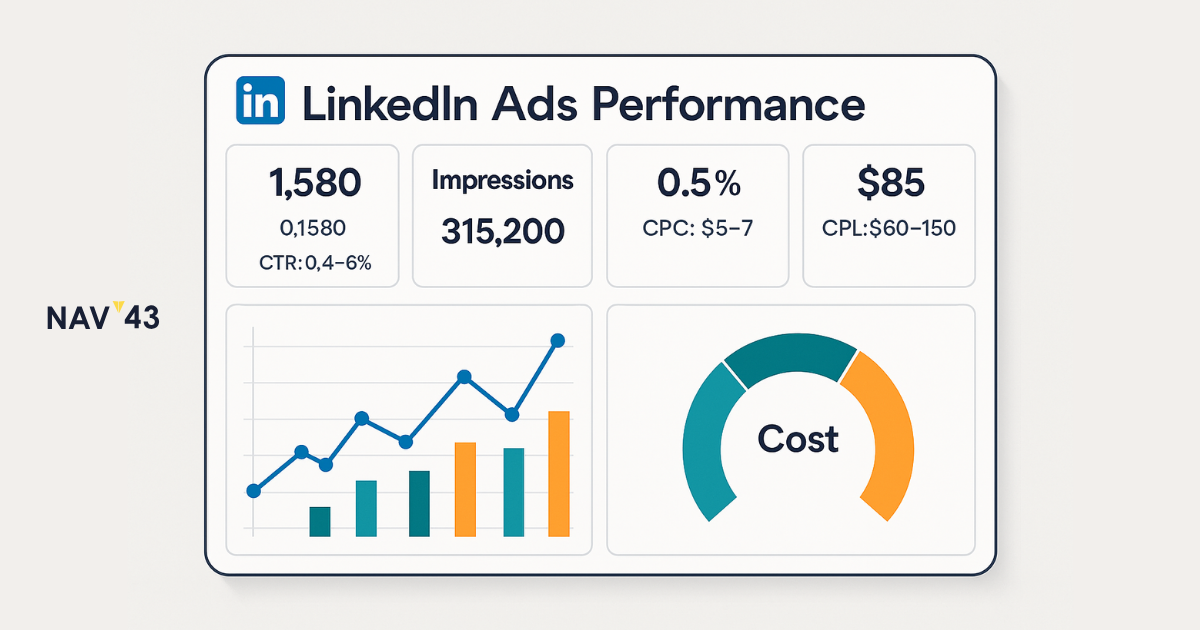
Here’s what you need to know upfront: LinkedIn CTR typically ranges from 0.4% to 0.6% for sponsored content, with CPCs averaging between $5 and $7, although FinTech targeting can increase this to $ 20 or more. Cost-per-lead (CPL) typically ranges from $60 to $ 150, but enterprise FinTech deals often exceed $200 due to the need for highly specific targeting requirements.
This guide provides comprehensive benchmark data across industries, ad formats, and specific FinTech use cases. You’ll learn how to interpret these metrics through the lens of pipeline velocity rather than vanity metrics, understand the nuances of 320-day enterprise sales cycles, and discover tactical frameworks to beat industry averages. Staying informed about industry trends is crucial for marketers to remain competitive and adjust their strategies as the market evolves.
Most importantly, we’ll show you how to tie LinkedIn performance to what actually matters: marketing-qualified pipeline, security-qualified meetings, and revenue acceleration. By tracking your marketing performance against benchmarks, you can identify optimization opportunities and drive better results. Because in enterprise FinTech, a $200 lead that closes a $500K deal beats a $50 lead that goes nowhere.
2. Why Benchmarks Matter for Your LinkedIn Strategy
Benchmarks aren’t just numbers to impress your boss, they’re the foundation of strategic decision-making. Without realistic baselines, you’re essentially flying blind, making promises you can’t keep and burning budget on campaigns destined to disappoint.
Here’s why benchmarks are non-negotiable for B2B marketers:
First, they enable accurate budget forecasting. When you know the average CPL in your industry is $120, you can calculate exactly how much budget you need to generate your target pipeline. No more awkward conversations about why you spent $50K to generate 400 leads instead of the 2,000 your CEO expected based on Facebook benchmarks.
Second, benchmarks provide context for performance evaluation. A 0.5% CTR might seem disappointing until you realize the LinkedIn average is 0.4-0.6%. Suddenly, you’re not failing,you’re right on track. This context prevents knee-jerk optimization decisions that often make performance worse.
Third, they facilitate stakeholder buy-in. CFOs and boards understand benchmarks. When you can show that your $150 CPL aligns with industry standards for enterprise FinTech, and that LinkedIn delivers 113% ROAS compared to Google’s 78%, budget approvals become significantly easier.
Finally, benchmarks help identify opportunities for optimization. If your CTR is 0.3% when the benchmark is 0.5%, you know to focus on creative and targeting. If your CPL matches benchmarks but pipeline velocity lags, the issue lies in lead quality or sales alignment, not ad performance.
3. Global LinkedIn Ads Performance Benchmarks (All Industries)
Let’s establish the baseline. These global benchmarks represent median performance across all industries and company sizes, providing detailed insights into LinkedIn Ads performance for a wide range of sectors. Your specific results will vary based on targeting precision, creative quality, and offer strength.
Our data reveals new trends and key findings in LinkedIn Ads benchmarks, helping you understand how your campaigns compare to industry standards.
3.1 Click-Through Rate (CTR)
LinkedIn’s average CTR for sponsored content hovers between 0.4 and 0.6%. This might seem low compared to search ads, but remember: LinkedIn users aren’t actively searching for solutions. They’re browsing professional content between meetings.
Several factors significantly impact CTR performance. Audience size plays a crucial role; targeting 50,000 professionals typically yields higher CTR than targeting 5,000 C-suite executives. Engagement rate is another important metric to track alongside CTR, as it measures how your audience interacts with your content through likes, comments, shares, and clicks. Monitoring engagement rate benchmarks can help you assess campaign performance and compare results against industry standards.
Creative format matters too: native-feeling content that provides immediate value and aligns with audience interest consistently outperforms salesy promotional material. The sweet spot? Create content that stops the scroll without screaming “advertisement.” Think provocative statistics, counterintuitive insights, or recognizable industry challenges. Your creative needs to earn attention in a feed full of professional updates and thought leadership.
3.2 Cost-Per-Click (CPC)
The global median CPC on LinkedIn ranges from $5-7, though this varies dramatically by targeting parameters, bidding strategy, and the competitive landscape. LinkedIn’s CPC is a key metric influenced by competitive bidding strategies, ad quality, and audience engagement, making it essential for optimizing ad performance and benchmarking within industry standards. Understanding the nuances here can save you thousands in wasted spend.
LinkedIn offers three primary bidding models. Cost-per-click (CPC) bidding charges only for clicks, making it ideal for traffic-driving campaigns with strong landing pages. Cost-per-impression (CPM) works best for brand awareness plays where reach matters more than engagement. Cost-per-send (CPS), used for Message Ads, charges $0.50-1.00 per message sent regardless of opens. Optimizing your ad space by carefully selecting placements can maximize reach and engagement, improving overall campaign performance and ROI.
Here’s what most marketers miss: LinkedIn’s auction dynamics reward relevance. A highly relevant ad targeting a narrow audience can achieve $3 CPCs, while a generic ad targeting “all finance professionals” might hit $15+. The platform’s algorithm favors ad quality over brute-force bidding—higher ad quality can lower costs and improve campaign effectiveness.
3.3 Conversion & Completion Rates
Lead Gen Forms typically achieve a 0.5% submit CTR with 6-10% form completion rates once opened. These native forms consistently outperform external landing pages by reducing friction, users can submit without leaving LinkedIn. When evaluating LinkedIn campaign effectiveness, it’s important to track not just completion rates but also the overall conversion rate—the percentage of users who take the desired action after engaging with your ad.
The key to maximizing completion rates? Progressive profiling. LinkedIn auto-fills professional information, so only ask for what you truly need. Each additional field reduces completion by roughly 5%. A three-field form asking for work email, company size, and biggest challenge will dramatically outperform a ten-field interrogation.
Quality matters more than quantity here. A 6% completion rate with highly qualified leads beats a 10% rate full of tire-kickers. Design your forms to self-select for serious buyers by asking qualifying questions upfront.
3.4 Cost-Per-Lead (CPL)
Brace yourself: LinkedIn CPLs range from $60-150+ on average, with enterprise B2B often exceeding $200. Yes, that’s 10x what you might pay on Facebook. But comparing LinkedIn to Facebook is like comparing a surgeon’s scalpel to a butter knife,they serve entirely different purposes.
Why the premium? LinkedIn offers unmatched professional targeting. You’re not hoping someone interested in “business” sees your ad,you’re reaching verified VPs of Finance at companies with 500+ employees in specific industries. That precision commands a premium.
The math works when you consider deal values. A $150 CPL that generates one $50K deal from every 50 leads yields a 6.7x return. Compare that to $15 Facebook leads that never progress past “just browsing” and the value becomes clear.
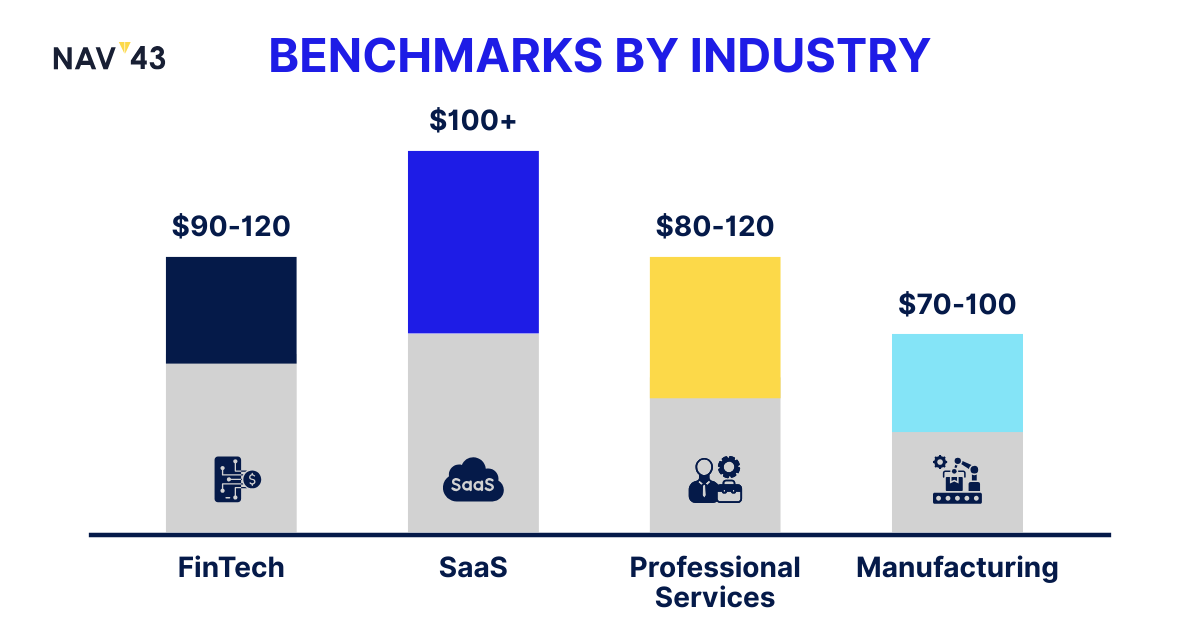
4. Benchmarks by Industry
Industry context transforms raw benchmarks from interesting data points into actionable intelligence. By analyzing industry leaders, you can gain valuable benchmarks to improve your own LinkedIn advertising strategies. Let’s examine how different verticals perform and why.
4.1 Finance & Insurance
Here’s where things get interesting. Broad finance and insurance targeting shows surprisingly low CPCs of $2.50-3.00, but don’t let this fool you. These numbers include consumer finance and insurance, which behave nothing like enterprise FinTech.
When you narrow targeting to CFOs, treasurers, and risk officers at enterprise companies, CPCs jump to $5-20. Why? Competition intensity. Every FinTech vendor, consultancy, and solution provider targets the same 50,000 finance executives. It’s a knife fight in a phone booth.
Typical CPLs for quality enterprise finance leads range from $90-120, though highly targeted ABM campaigns often exceed $200. The key is ensuring lead quality justifies the premium. One enterprise CFO evaluating your solution beats 20 analysts downloading your whitepaper out of curiosity.
4.2 SaaS / Software
Software companies face a unique challenge: everyone claims to be “interested in innovation,” but few have budget and authority. This dynamic drives SaaS CPCs to $5-8 with CPLs typically exceeding $100.
The real issue? Extended nurture cycles. SaaS buyers research extensively, comparing dozens of options over months. Your LinkedIn campaigns must account for this journey, balancing awareness content with decision-stage assets.
Smart SaaS marketers segment by company technographics and buying signals. Targeting companies using competitor tools or showing growth indicators yields higher CPCs but dramatically better pipeline conversion. Pay $150 for a lead from a company using your competitor versus $75 for a cold prospect,the math favors precision.
4.3 Professional Services
Professional services enjoy relatively favorable benchmarks with CPCs around $4-6 and CPLs between $80-120. The human element of services creates natural differentiation that pure software plays lack.
CTR often exceeds LinkedIn averages, hitting 0.6-0.8% when featuring recognized thought leaders or addressing specific pain points. People buy from people in professional services, making personality-driven content particularly effective.
The challenge lies in lead quality. Professional services attract many “information seekers” who want free advice without purchase intent. Combat this by gating high-value content behind qualification questions about project timelines and budgets.
4.4 Manufacturing & Industrial
Manufacturing represents LinkedIn’s hidden gem with CPCs of $3-5 due to lower competition. However, reaching the right stakeholders proves challenging, plant managers and procurement officers aren’t always active LinkedIn users.
CPLs typically range from $70-$100, but conversion to pipeline often lags other industries. Manufacturing decisions involve multiple stakeholders across operations, finance, and technical teams, which can extend sales cycles.
Success requires patience and multi-threading. Target broadly across job functions initially, then narrow based on engagement data. A skilled quality engineer can often unlock entire buying committees.
5. Benchmarks by Ad Format
Not all LinkedIn ad formats are created equal. Each serves specific funnel stages and objectives, with vastly different performance characteristics. Developing effective ad strategies and linkedin ads strategies tailored to each format is essential for maximizing results.
By leveraging actionable strategies based on benchmark data, you can continuously improve your campaign performance.
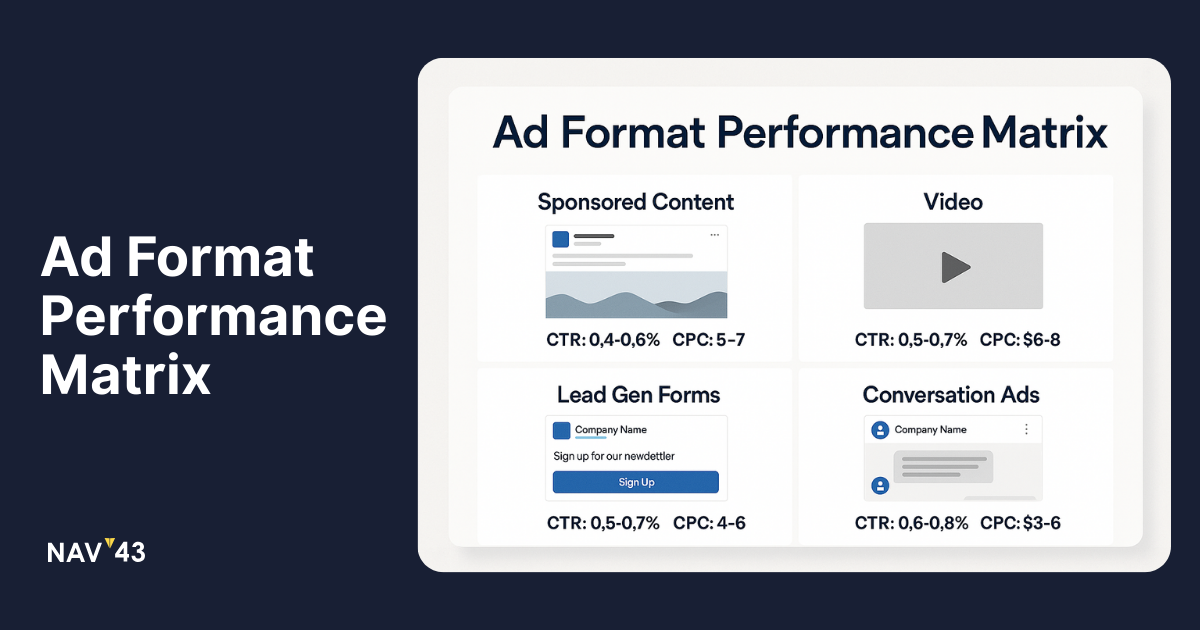
5.1 Sponsored Content (Static & Carousel)
Sponsored Content remains LinkedIn’s workhorse, delivering consistent 0.50-0.60% CTR at $5-7 CPC. Static posts work best for single, powerful messages, while carousels excel at storytelling or showcasing multiple products.
The format’s strength lies in native placement. Sponsored Content appears naturally in the feed, reducing “ad blindness.” Users engage with valuable content regardless of its promotional nature, particularly when it addresses real business challenges. Sponsored Content is especially effective for brand awareness campaigns, as it helps maximize reach and visibility at the top of the funnel. Monitoring CPM and engagement metrics is crucial for these campaigns to ensure your message is resonating with the target audience and efficiently reaching as many relevant users as possible.
Pro tip: Design for mobile-first consumption. Over 60% of LinkedIn usage happens on mobile devices, where your visuals and copy must work harder to capture attention in a smaller format.
5.2 Video Ads
LinkedIn video ads are a key ad format, offering unique opportunities for brand awareness and engagement. They typically deliver a ~0.40% CTR and elevated CPCs of $7-9. While these performance benchmarks show that video ads excel at awareness and brand building, they often underperform for direct response.
Why the lower CTR? Video content requires commitment. Users must stop scrolling and invest time watching, creating a natural friction point. However, those who do engage show higher intent and brand recall.
Keep videos under 30 seconds with captions for silent autoplay. Lead with your strongest hook in the first 3 seconds, you’re competing with endless scroll momentum. Video content is especially important for driving engagement, making it ideal for thought leadership, customer stories, and product demonstrations that benefit from visual storytelling.
Consider experimenting with LinkedIn Live to engage your audience through real-time video streaming and further expand your video strategy.
5.3 Lead Gen Forms
Lead Gen Forms are LinkedIn’s conversion powerhouse, achieving ~0.50% CTR with 6-10% completion rates. These lead generation forms simplify the user experience by allowing users to submit their information directly within LinkedIn ads, which helps increase conversion rates and reduce cost-per-acquisition. By keeping users on-platform, these forms reduce friction and boost conversions by 2x versus external landing pages.
The secret sauce? LinkedIn’s auto-fill functionality. Users can submit forms with 2-3 clicks, dramatically reducing abandonment. This convenience does attract some lower-intent leads, making follow-up qualification crucial.
Optimize forms for quality over quantity. Include 1-2 qualifying questions about budget, timeline, or specific challenges. You’ll capture fewer leads but waste less time on prospects who aren’t ready to buy.
5.4 Conversation Ads
Conversation Ads (formerly Sponsored InMail) deliver impressive ~3% headline CTR at $0.50-1.00 cost-per-send. These interactive messages excel at personalized outreach for ABM campaigns. The format’s strength lies in creating dialogue. Instead of one-way broadcasting, you can build branching conversations that adapt to user responses. “Are you struggling with compliance?” leads to different paths than “Looking to reduce payment processing costs?”
Expect CPLs exceeding $100 due to the CPS model and selective audience targeting. The investment pays off for high-value ABM plays where personalization matters. Just remember: users can only receive one Conversation Ad per 30 days, so make it count.
5.5 Text & Spotlight Ads
Text and Spotlight Ads deliver minimal ~0.02% CTR but serve a specific purpose: cost-effective reach and frequency building. Think of them as billboard supplements to your primary campaigns.
At $2-3 CPC, they seem affordable until you calculate the volume needed for meaningful results. These formats work best for brand awareness, event promotion, or remarketing touches rather than primary lead generation.
Use them strategically as air cover for your main campaigns. A prospect who sees your Sponsored Content, then notices your Text Ad, then receives your Conversation Ad builds familiarity that improves overall campaign performance. During peak periods, test dynamic ads alongside text and spotlight ads to maximize engagement and optimize your results.
6. Enterprise FinTech Nuances & Caveats
Enterprise FinTech operates in a parallel universe where standard B2B rules barely apply. Understanding these nuances separates successful campaigns from expensive failures. Unlike the shorter sales cycles seen in other industries—which enable quicker conversion of MQLs into SQOs and more agile pipeline management—enterprise FinTech often faces longer, more complex sales processes.
6.1 Buying Committees & Sales Cycle Length
Forget everything you know about B2B buying groups. Enterprise FinTech deals now involve an average of 8.5 stakeholders, up from 6.8 just three years ago. Each additional stakeholder extends the sales cycle by roughly 3-4 weeks.
The typical enterprise FinTech buying journey spans 211-320 days from first touch to closed won. That’s not a typo,you’re looking at 7-11 months minimum. Large enterprises often push this beyond a year when factoring in security reviews, compliance checks, and implementation planning.
This reality demands radical patience and strategic thinking. Your LinkedIn campaigns must nurture prospects for months, not weeks. Build content calendars that assume 20+ touchpoints across multiple stakeholders. One-and-done campaign strategies simply don’t work here.
6.2 Regulatory & Compliance Barriers
Here’s a sobering statistic: 93% of FinTech companies struggle to meet compliance standards. This isn’t just a vendor problem, it’s a buyer problem too. Enterprise finance teams must ensure any new solution meets KYC, AML, SOC 2, and countless other regulatory requirements.
These compliance requirements create unique funnel stages. After initial interest, prospects often enter a “compliance purgatory” lasting 2-3 months. Security questionnaires alone can involve 300+ questions across data handling, encryption, access controls, and disaster recovery.
Smart marketers track “security-qualified meetings” and “compliance questionnaires initiated” as leading indicators. A prospect who starts your security review shows serious intent,they wouldn’t invest that effort otherwise. Build campaigns that acknowledge and address these barriers head-on.
6.3 Targeting CFOs & Risk Officers
CFO targeting on LinkedIn is the digital equivalent of spearfishing in the middle of a feeding frenzy. Every vendor wants their attention, driving CPCs to $15-20+ for quality audiences.
The challenge intensifies when targeting risk and compliance officers. These professionals maintain lower LinkedIn presence and engagement, making them expensive to reach. When you do find them, they’re bombarded with vendor messages.
Success requires surgical precision. Layer targeting by company technographics, recent leadership changes, or regulatory events. A new CFO at a high-growth FinTech represents 10x the opportunity of a tenured executive at a stable institution. Pay the premium for precision,it’s cheaper than wasting money on unlikely buyers.
7. Interpreting Benchmarks: From Leads to Pipeline Velocity
Most marketers track LinkedIn success through a funnel that looks like this: Impressions → Clicks → Leads → MQLs. This worked fine in 2015. In 2025’s enterprise reality, it’s dangerously myopic.
When comparing paid ads on LinkedIn to other social media platforms, LinkedIn often delivers a higher pipeline impact for B2B marketing, despite higher costs, due to its superior lead generation and return on ad spend.
Integrating LinkedIn benchmarks into your overall social media strategy helps you measure, optimize, and improve marketing performance across all platforms.
7.1 Key Pipeline Metrics to Track
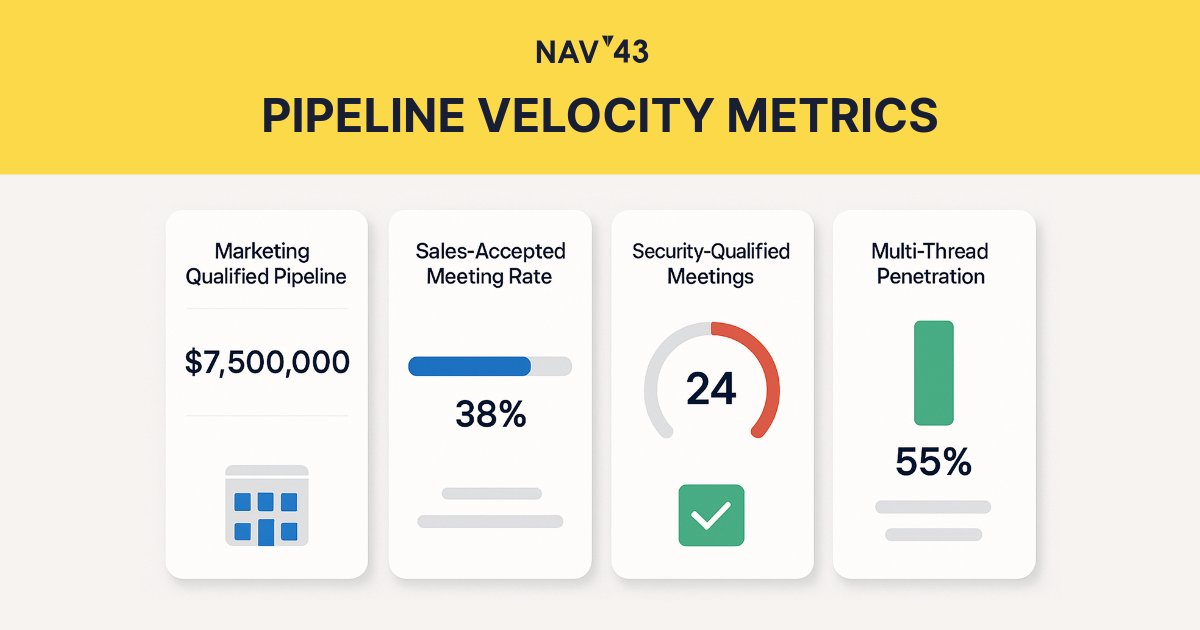
Replace vanity metrics with value metrics that reflect enterprise FinTech reality. Here’s what actually matters:
- Marketing Qualified Pipeline (MQP): Track the dollar value of opportunities influenced by LinkedIn, not just lead volume. One $500K opportunity beats 100 unqualified leads.
- Sales-Accepted Meeting Rate: What percentage of leads result in sales-accepted meetings? This reveals lead quality better than any score.
- Security-Qualified Meetings: For enterprise FinTech, track prospects who’ve initiated security reviews or compliance discussions. This indicates serious evaluation beyond casual interest.
- Multi-Thread Penetration: How many stakeholders from target accounts engage with your campaigns? Single-threaded deals die when your champion leaves.
The shift from lead-centric to pipeline-centric measurement transforms campaign optimization. Suddenly, a campaign generating 50 leads and $2M pipeline outperforms one generating 200 leads and $500K pipeline, even at higher CPL.
7.2 Time-to-Revenue Analysis
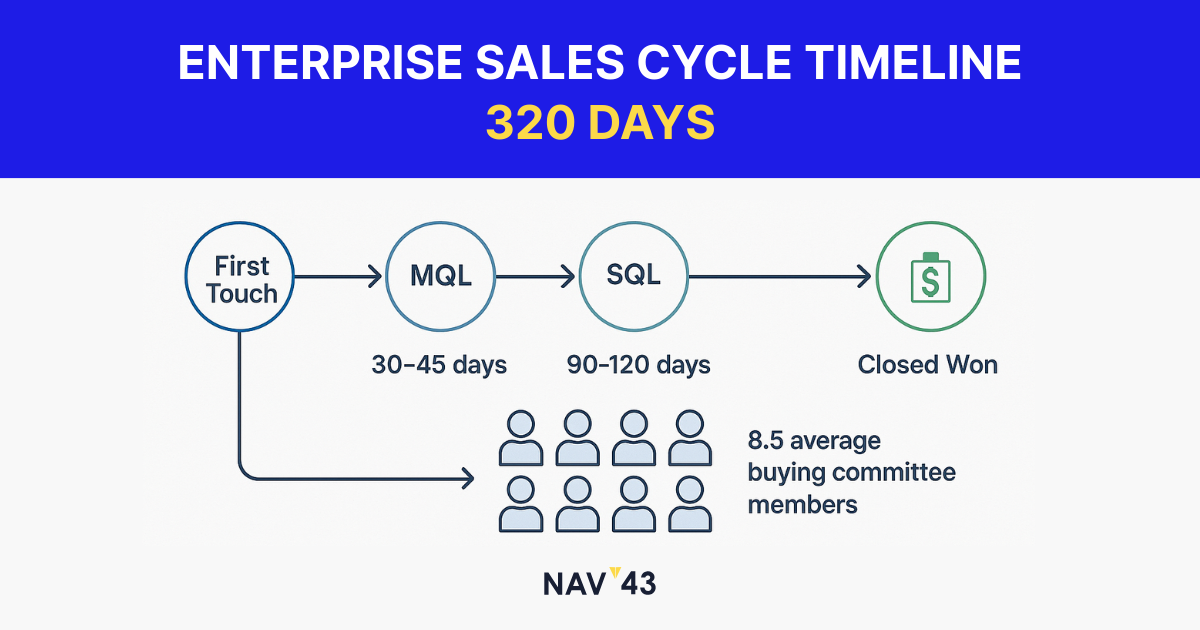
LinkedIn’s impact on revenue extends far beyond last-click attribution. Dreamdata’s research shows it takes an average of 320 days from initial LinkedIn ad engagement to closed revenue. Breaking this down:
- First touch to MQL: 30-45 days
- MQL to SQL: 90-120 days
- SQL to Closed Won: 120-180 days
This timeline has profound implications for measurement and optimization. Judging LinkedIn campaigns on 30-day performance is like judging a marathon runner after the first mile. You need measurement windows that match business reality.
Track velocity improvements as a key success metric. If your campaigns reduce average sales cycle from 320 to 280 days, that 12.5% improvement dramatically impacts cash flow and ROI. A slightly higher CPL that accelerates pipeline velocity often delivers superior business outcomes.
8. Tactics to Beat the Benchmarks
Knowing benchmarks is step one. Beating them requires systematic optimization across creative, targeting, and conversion elements. Leveraging content marketing and Google Ads alongside LinkedIn can further maximize your results by reaching broader audiences and enhancing your B2B marketing strategy.
In addition, tracking engagement metrics is essential to inform your tactics and continuously improve campaign performance.
8.1 Creative & Copy Frameworks
The most effective LinkedIn creative follows a “Hook-Problem-Solution” framework that respects the professional context while commanding attention.
Hook formulas that consistently outperform:
- Counterintuitive statistics: “Why 73% of CFOs are wrong about payment optimization”
- Pattern interrupts: “We helped [Company] reduce compliance costs by 40%. Here’s what nobody tells you…”
- Authority challenges: “The traditional approach to KYC is broken. Here’s proof:”
- Your visuals need “thumb-stopping
