LinkedIn and Google Demand Capture: Full-Funnel B2B Blueprint
About 95% of winning vendors are already on the buyer’s shortlist before they ever search Google (6sense 2025 B2B Buyer Experience Report). If you’re not there, you’re not competing. You’re just bidding.
That statistic from 6sense’s 2025 B2B Buyer Experience Report stopped me cold when I first read it. But the follow-up data hit even harder: 80% of deals are won by the pre-contact favorite (6sense 2025 B2B Buyer Experience Report).ls are won by the vendor the buyer preferred before they ever made contact (6sense, 2025). Not the vendor with the best demo. Not the one with the lowest price. The one they already trusted.
Here’s the uncomfortable truth most B2B marketers face: they’re optimizing the wrong part of the funnel. They pour budget into Google Ads to capture demand from buyers who have already made up their minds. The real competition happened months earlier, when those buyers were forming opinions, consuming content, and building mental shortlists. And that competition? It happened on LinkedIn.
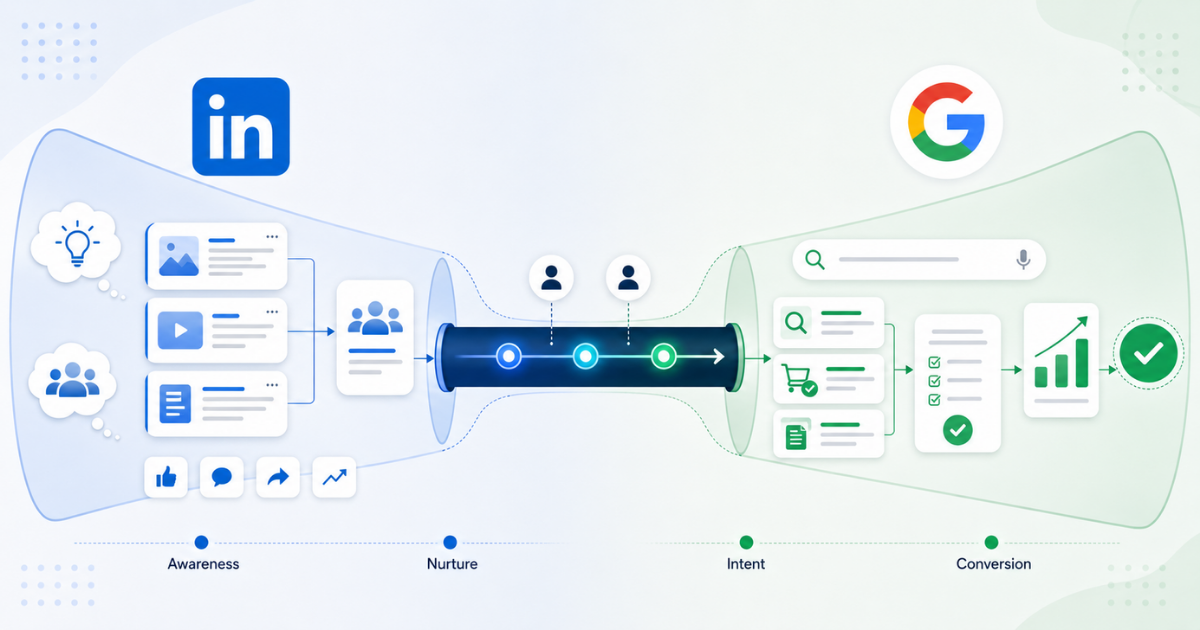
The question isn’t “Should I invest in LinkedIn brand building or Google demand capture?” That’s a false choice. The highest-performing B2B teams use LinkedIn to get ON the shortlist (for the 95% not yet buying) and Google to CAPTURE demand (from the 5% actively searching). The magic happens when these two work together.
This article breaks down the exact framework we use at NAV43 to build full-funnel demand engines for B2B clients. You’ll learn the strategic foundation behind the 95-5 rule, how LinkedIn’s content rules map to it, the sequencing playbook that turns brand awareness into a captured pipeline, and how to measure success when buyer journeys stretch to 272 days.
The Day-1 Shortlist Problem (And Why Your Google Ads Can’t Solve It)
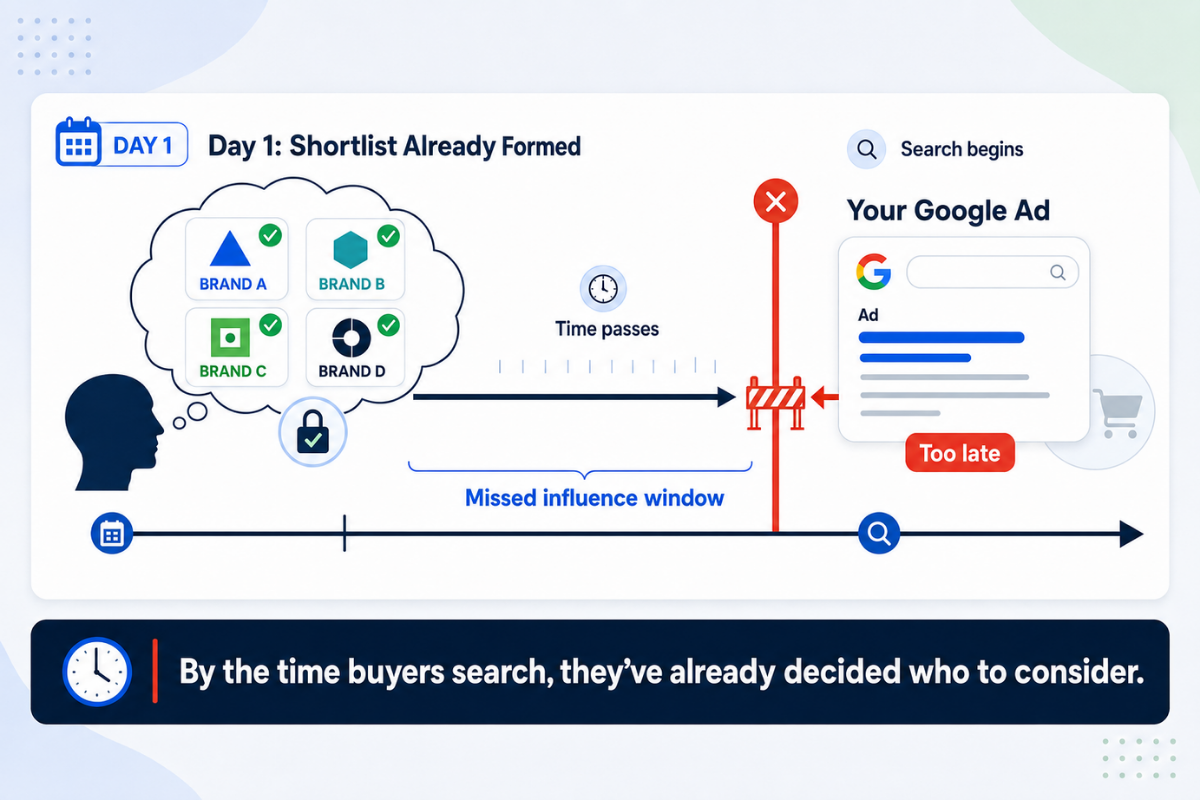
Let me paint you a picture. A VP of Marketing at a mid-market SaaS company realizes they need a new marketing automation platform. Before they type a single search query into Google or fill out a single demo request form, they already have a mental shortlist of 3-4 vendors they’d consider.
Where did that shortlist come from? Not from your Google Ads. Not from your website. It came from months of passive exposure: a thought leadership post they saw on LinkedIn, a podcast episode featuring your CEO, a case study shared by a peer they respect.
The 6sense research confirms this pattern at scale. When buyers enter an active buying cycle, 95% already know which vendors they’ll evaluate (6sense 2025 B2B Buyer Experience Report). The window to influence that decision closed long before you had a chance to bid on their search query.
This is why Google Ads alone can’t solve your pipeline problem. Google captures existing demand brilliantly. It’s the best demand capture tool ever created. But it captures demand that was shaped elsewhere, usually on LinkedIn, where B2B buyers spend time before they’re ready to buy.
Consider the math: 80% of B2B social media leads come from LinkedIn (LinkedIn, Sprout Social, 2025). LinkedIn Ads delivered an average ROAS of 121% in 2025, outperforming Google Search at 67% and Meta at 51% (Dreamdata, 2026). Yet most B2B marketers still allocate the majority of their budget to Google.
The strategic implication is clear. If you want to win more deals, you need to win the shortlist battle first. And that battle is fought on LinkedIn, not Google.
What Is the 95-5 Rule on LinkedIn (And Why It Changes Everything)
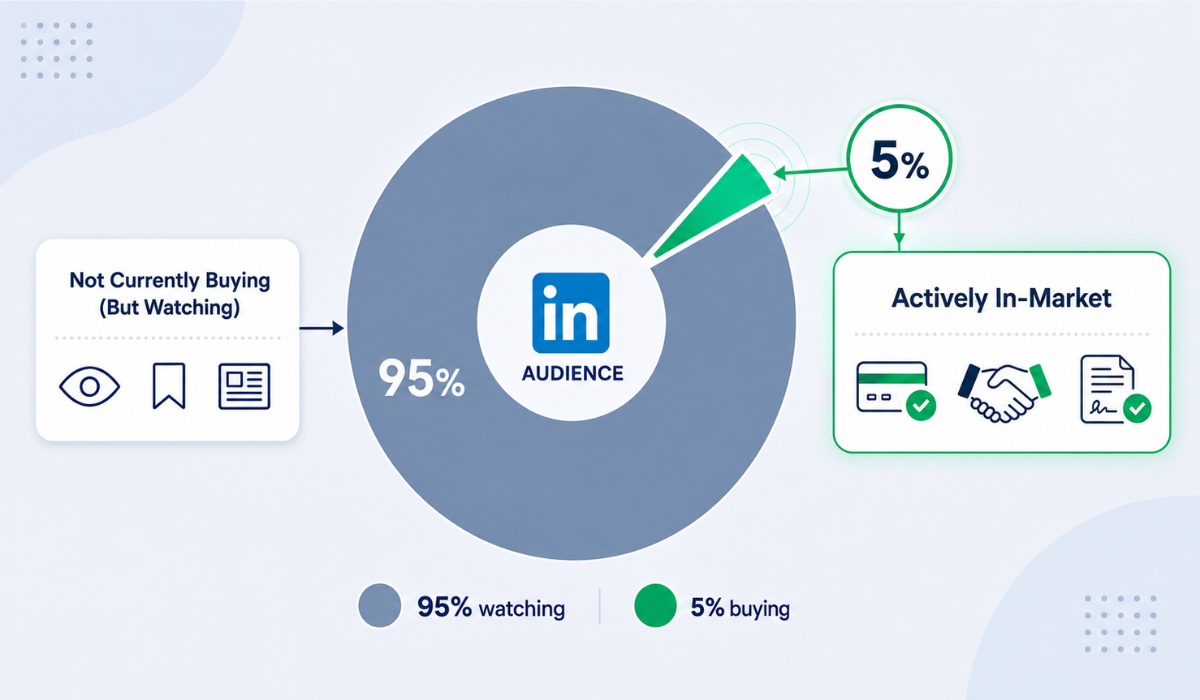
The 95-5 rule is the most important concept in B2B marketing, yet most marketers have never heard of it. Developed by the B2B Institute in partnership with the Ehrenberg-Bass Institute, it states a simple truth: at any given time, only 5% of your target market is actively in-market to buy. The other 95% are out-of-market but will eventually enter a buying cycle.
This isn’t a LinkedIn-specific concept. It’s a fundamental market reality backed by decades of research. But it has massive implications for how you should allocate marketing resources.
Most B2B marketing is optimized for the 5%. Demo CTAs everywhere. Bottom-funnel content gates. Aggressive retargeting. Google Ads campaigns targeting high-intent keywords. These tactics make sense for capturing the small slice of buyers ready to purchase today.
But here’s what the 95-5 rule reveals: the 95% determines WHO is on the Day-1 shortlist when they eventually become the 5%. If you’re invisible to buyers while they’re out of the market, you won’t exist in their minds when they enter the market.
LinkedIn is uniquely positioned to reach the 95%. Unlike Google, where users have active purchase intent, LinkedIn captures professionals during their daily work routines. They’re scrolling between meetings, catching up on industry trends, and engaging with peers. They’re not buying today, but they’re forming opinions about who they’d buy from when the time comes.
This is why LinkedIn content strategy isn’t just about generating leads. It’s about building what researchers call “mental availability,” which is the probability that your brand comes to mind when a buyer enters a purchase situation. Every piece of thought leadership, every employee post, every comment thread contributes to that mental availability.
The 95-5 Rule Explained
Segment Percentage What They Need Primary Channel In-Market Buyers 5% Proof, pricing, demos, comparisons Google Search, retargeting Out-of-Market Future Buyers 95% Education, thought leadership, brand familiarity LinkedIn organic + paid
The contrast with Google couldn’t be sharper. Google captures the 5% with existing intent. LinkedIn builds the mental availability that determines which brands the 95% will consider when they become the 5%.
Why Measuring LinkedIn on 30-Day Windows Is Fundamentally Broken
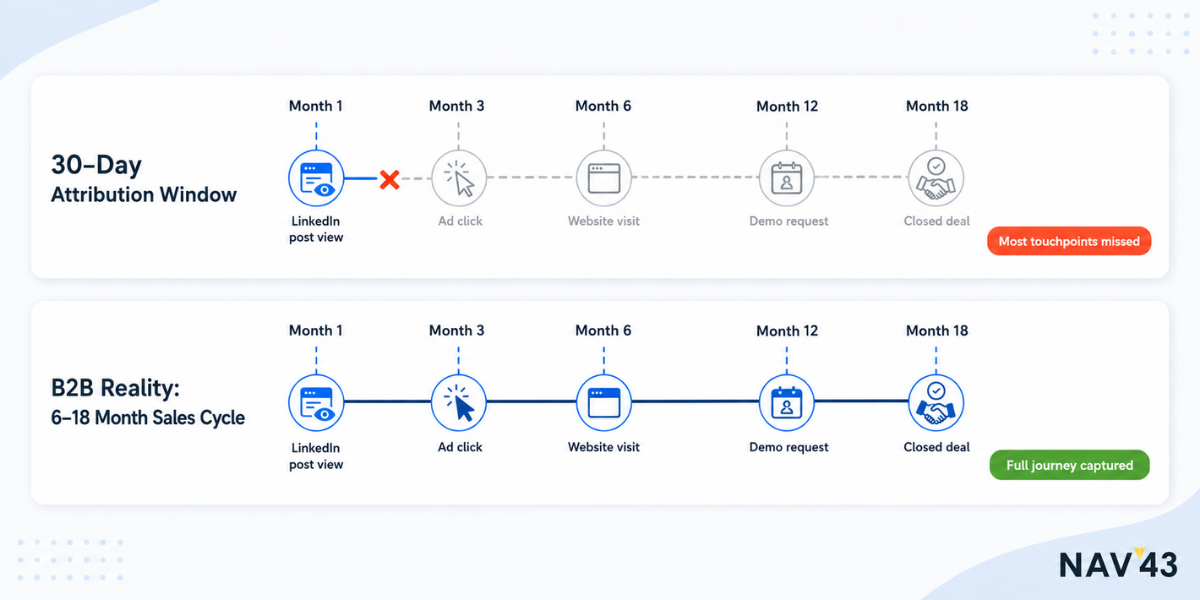
Here’s a stat that should reframe how you think about LinkedIn ROI: the average B2B customer journey is now 272 days from first touch to closed deal, up from 211 days in the prior year (Dreamdata, 2026). Some B2B categories see journeys exceeding 10 months (6sense, 2025).
If you’re measuring LinkedIn performance on 30-day attribution windows, you’re missing the majority of the actual journey impact, given the average B2B customer journey is 272 days from first touch to closed deal (Dreamdata 2026 Benchmark Report). You’re judging a marathon runner on their first hundred meters.
This is why LinkedIn “looks bad” in most marketing dashboards. The buyer who engaged with your thought leadership post today won’t search your category for another 8 months. By then, the LinkedIn touchpoint has fallen out of every attribution model, and Google gets credit for the conversion.
But here’s what the data actually shows when you measure properly: LinkedIn influences 28.3% of new business deals across all funnel stages, not just top-of-funnel awareness (LinkedIn, 2025). The influence is real. The measurement is broken.
The solution isn’t to abandon LinkedIn measurement. It’s to extend your attribution windows and adopt cohort-based tracking that follows accounts from their first LinkedIn touch to their eventual Google conversion. We’ll cover exactly how to do this later in this article.
Decoding LinkedIn’s Content Rules: 5-3-2, 4-1-1, and 3-2-1 Explained
If you’ve spent any time researching LinkedIn content strategy, you’ve encountered various “rules” with numeric names: the 5-3-2 rule, the 4-1-1 rule, the 3-2-1 rule. These can feel like arbitrary posting ratios dreamed up by social media gurus.
They’re not. Each rule is a tactical implementation of the 95-5 principle. They all balance value-first content (serving the 95% who aren’t buying) with promotional content (capturing the 5% who are). The differences come down to how aggressive your promotional mix should be based on your audience, industry, and content capacity.
Let’s decode each one.
What Is the 5-3-2 Rule on LinkedIn?
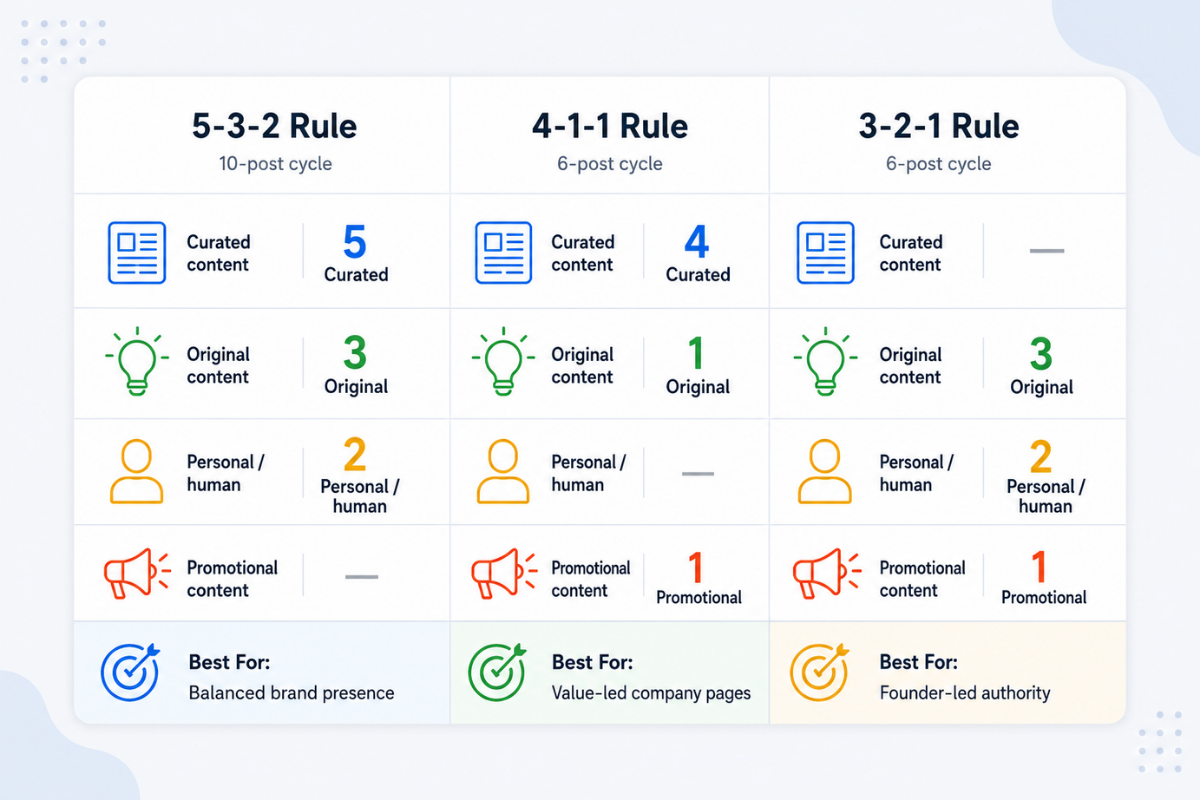
The 5-3-2 rule structures every 10 pieces of content as follows:
- 5 pieces of curated or shared content – Content from other sources that provides value to your audience
- 3 pieces of original content – Your own thought leadership, insights, and perspectives
- 2 pieces of personal or humanizing content – Behind-the-scenes, team spotlights, personal reflections
The purpose is to build trust and authority without overwhelming followers with self-promotion. When 70% of your content comes from external sources or personal connections (the 5 + 2), you’re positioning yourself as a curator and human being, not just a salesperson.
Mapping this to the 95-5 framework: the curated and personal content serves the 95% with value and relationship-building. The 3 original pieces can include soft demand capture elements for the 5% ready to engage, but even these should lead with insight rather than pitch.
We’ve found the 5-3-2 ratio works best for companies building thought leadership in crowded categories where differentiation comes from perspective rather than product features. It’s particularly effective when executed through personal profiles rather than company pages, given that personal LinkedIn profiles generate 8x more engagement than company pages (Digital Applied, 2026).
What Is the 4-1-1 Rule on LinkedIn?
The 4-1-1 rule structures every 6 pieces of content as:
- 4 pieces of educational or valuable content – Insights, how-tos, industry analysis
- 1 piece of soft promotion – Case studies, customer stories, thought leadership with subtle brand connection
- 1 piece of direct promotion – Product announcements, demo invitations, sales content
This ratio maintains a 67% value-to-33% split between value and promotion. The educational content builds mental availability with the 95%. The promotional content captures 5% of the ready-to-engage audience.
When to use the 4-1-1 rule: It’s ideal for companies with strong content engines that can produce consistent educational material. If your team can sustain four pieces of genuinely valuable content for every promotional piece, this ratio drives strong engagement while maintaining conversion opportunities.
What Is the 3-2-1 Rule on LinkedIn?
Multiple interpretations exist for the 3-2-1 rule, ranging from employee content ratios to post-structure formulas. The most useful interpretation for B2B demand generation:
- 3 value posts – Pure education, insights, helpful content
- 2 engagement posts – Conversation starters, questions, polls, community building
- 1 promotional post – Direct call-to-action content
This creates an 83% value/engagement mix (serving the 95%) versus 17% promotional (capturing the 5%). It’s the most conservative ratio of the three.
We recommend the 3-2-1 rule for companies just starting their LinkedIn presence or operating in highly regulated industries where promotional content requires careful compliance review. The high value ratio builds audience trust quickly, creating permission to promote when you do have something to sell.
| Rule | Ratio | Best For | Content Serving 95% | Content Capturing 5% |
|---|---|---|---|---|
| 5-3-2 | 5 curated, 3 original, 2 personal | Thought leadership in crowded markets | 70% | 30% |
| 4-1-1 | 4 educational, 1 soft promo, 1 direct promo | Teams with strong content capacity | 67% | 33% |
| 3-2-1 | 3 value, 2 engagement, 1 promotional | New presence or regulated industries | 83% | 17% |
Building the LinkedIn-to-Google Demand Capture Engine
Understanding the 95-5 rule and content ratios is necessary but not sufficient. The real competitive advantage comes from sequencing these elements into a coordinated demand engine that moves buyers from the first LinkedIn touch to Google conversion.
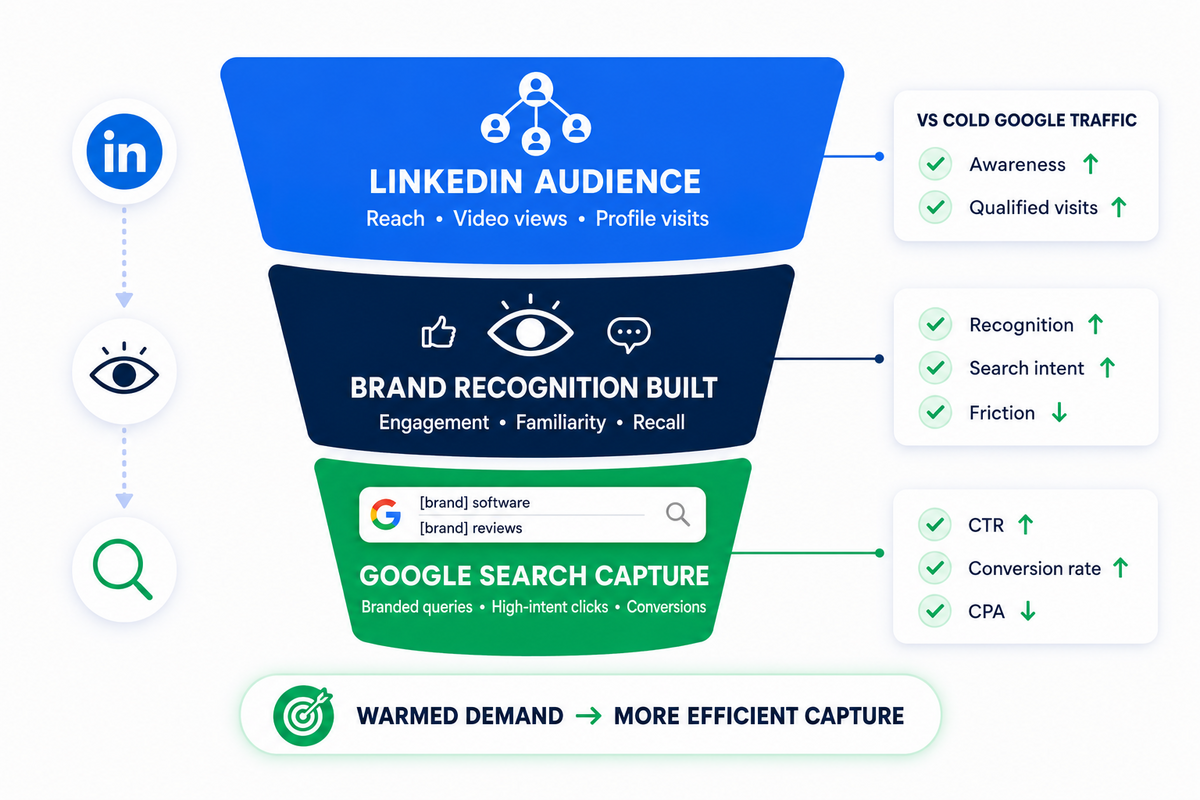
The core framework: LinkedIn for awareness and consideration, Google for decision and capture. But the execution is more nuanced than simply running both channels simultaneously. The sequence matters because buyers who recognize your brand from LinkedIn are more likely to click your Google ad AND convert once they do.
Our approach at NAV43 layers three phases: LinkedIn organic foundation, LinkedIn Ads amplification, and Google Search capture with cross-platform retargeting. Let me walk you through each phase with specific timing and metrics.
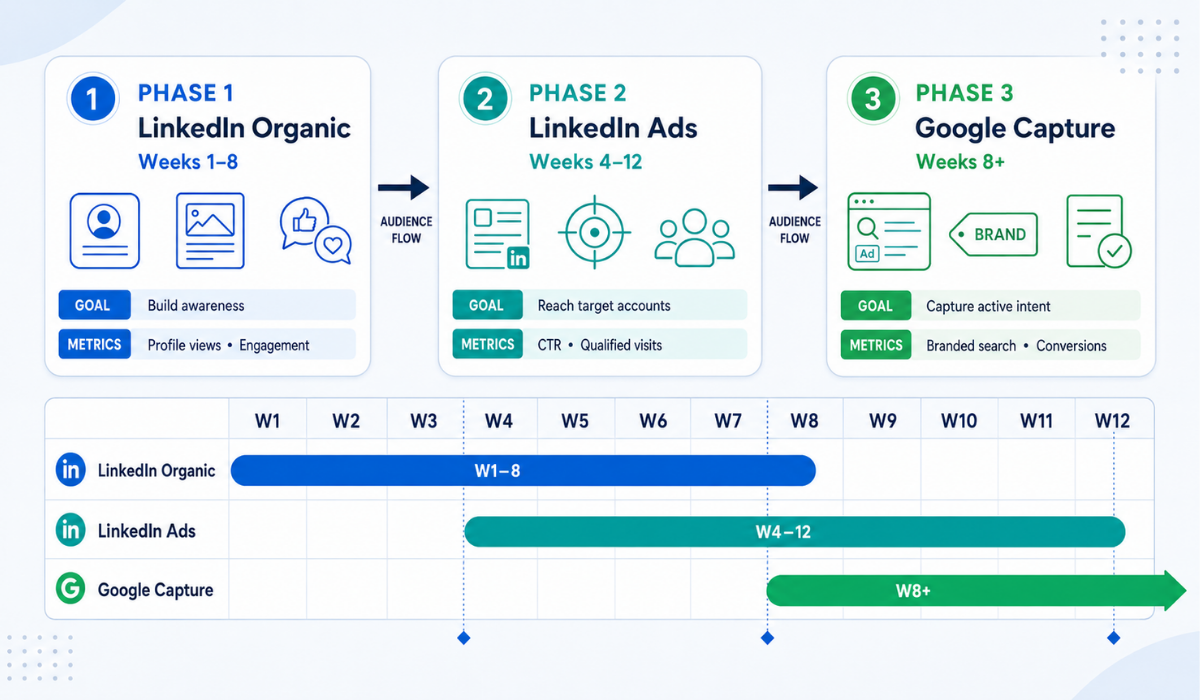
Phase 1: LinkedIn Organic Foundation (Weeks 1-8)
Start with personal profiles, not company pages. The 8x engagement differential is too significant to ignore (Digital Applied, 2026). Identify 3-5 key voices within your organization: executives, subject matter experts, and customer-facing leaders. These become your primary content channels.
The content mix should follow one of the ratios above, based on your capacity and industry. If you’re unsure, start with 3-2-1 and graduate to 4-1-1 once you’ve established a consistent publishing rhythm.
Focus your content on thought leadership that addresses the pain points of your target accounts. Not your product. Not your features. The problems your buyers face and the perspectives that help them solve those problems. You’re building mental availability, not running ads.
Activate employee advocacy alongside executive content. Arm your team with shareable content and clear guidelines. The compound effect of multiple voices sharing consistent themes builds brand presence faster than any single channel.
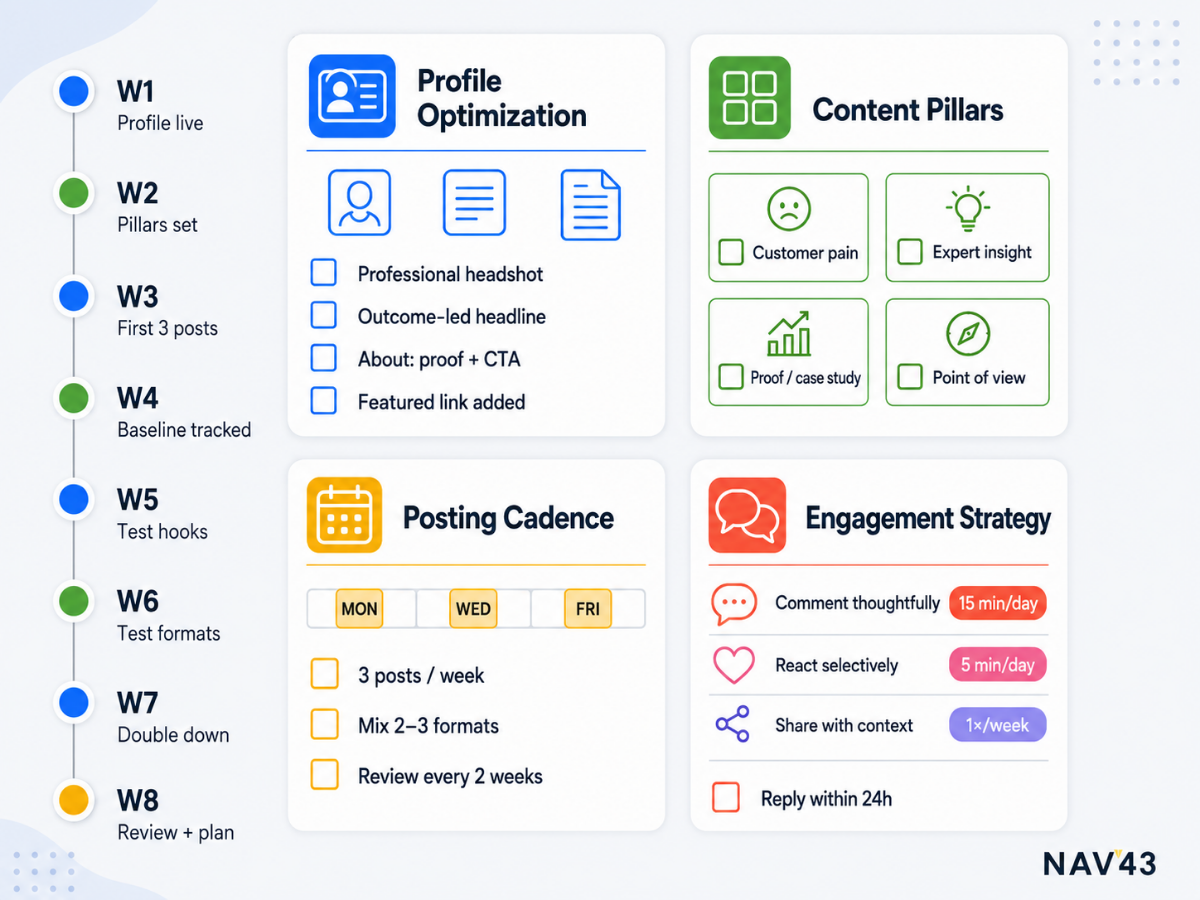
LinkedIn Organic Foundation Checklist:
- [ ] Optimize 3-5 personal profiles for target buyer searches (headline, about section, experience)
- [ ] Establish content calendar with weekly publishing cadence
- [ ] Define content pillars aligned to buyer pain points
- [ ] Create content templates for consistent quality and voice
- [ ] Launch employee advocacy program with shareable assets
- [ ] Set up LinkedIn analytics tracking for baseline metrics
- [ ] Build target account list in Sales Navigator
- [ ] Create engagement protocol for commenting on prospect content
- [ ] Develop crisis/compliance guidelines for employee posts
- [ ] Schedule weekly content planning and review sessions
Measurement in Phase 1 focuses on leading indicators: engagement rate, follower growth from target accounts, and profile views from target titles. Don’t expect the pipeline yet. You’re building the foundation that the pipeline will flow through later.
Note that 78% of B2B marketers use video on LinkedIn, and 56% plan to increase video use in 2026 (LinkedIn, 2025). Video content typically generates higher engagement, so incorporate it into your mix early.
Phase 2: LinkedIn Ads Amplification (Weeks 4-12)
Layer paid amplification once you have organic content that’s performing. The keyword is “layer,” LinkedIn Ads amplify what’s already working, not replace organic effort.
Thought Leader Ads are your first paid lever. These amplify top-performing organic posts from personal profiles, maintaining the authentic voice while extending reach. Identify posts that generated strong organic engagement and allocate budget behind them.
Sponsored Content scales educational content to lookalike audiences based on your existing engaged followers and customers. Target by job title, company size, industry, and seniority to reach more of the 95% who match your ideal customer profile.
Lead Gen Forms enter the mix for bottom-funnel offers, but only to warm audiences who’ve already engaged with your content. LinkedIn Lead Gen Forms convert at 13%, compared to 4% for landing pages (LinkedIn), because they reduce friction for mobile users. Use them for high-value offers like benchmark reports, assessment tools, or consultation calls.
Retargeting closes the loop by re-engaging video viewers, page visitors, and content engagers with progressive messaging. Someone who watched 75% of your video is a better lead gen target than a cold audience.
Budget allocation guidance for Phase 2: Start with 60% allocated to awareness campaigns (Thought Leader Ads, Sponsored Content) and 40% to conversion campaigns (Lead Gen Forms, retargeting). Adjust based on your sales cycle length – longer cycles warrant more awareness investment.
This is the exact sequencing we use with clients: LinkedIn Lead Gen Forms vs Landing Pages covers when to deploy each conversion mechanism for maximum impact.
Phase 3: Google Demand Capture (Weeks 8+)
Here’s where everything comes together. Google captures 5% of actively searching users, but only if they recognize you from LinkedIn.
Branded search campaigns capture buyers who saw your LinkedIn content and search your company name directly. These campaigns typically have the lowest CPAs and highest conversion rates because intent and brand awareness align. If your branded search volume is increasing, your LinkedIn investment is working.
Non-branded search campaigns target category terms and high-intent keywords. Expect higher CPCs here – non-branded CPC increased 29% to $5.34 in B2B, while CTR dropped 26% to 4.04% (Dreamdata, 2025). This is where LinkedIn brand building pays dividends: buyers who recognize your brand click more and convert more, even on non-branded terms.
RLSA (Remarketing Lists for Search Ads) is your secret weapon. Layer LinkedIn-sourced audiences onto Google Search campaigns. When someone who engaged with your LinkedIn content searches a category term on Google, your ad appears with boosted bids. This bridges the platforms and closes the attribution gap.
The average B2B cost per lead on Google Ads reached $70.11 in 2025, up 5.13% year-over-year (WordStream, 2025). Without LinkedIn brand building, creating preference before the search, you’re competing on price alone with every other vendor bidding on the same keywords.
For CRM integration that connects LinkedIn touches to Google conversions, see our HubSpot automation guide.
How to Split Budget Between LinkedIn and Google (Based on Your Sales Cycle)
“How much should we spend on LinkedIn versus Google?” This is the question I hear most often from marketing directors. The honest answer: it depends on three factors.
Your deal size determines how much relationship-building is necessary before purchase. Larger deals require more trust, which requires more LinkedIn investment.
Your sales cycle length determines how long buyers spend in the 95% before becoming the 5%. Longer cycles mean more time to influence opinions on LinkedIn.
Your current brand awareness determines whether you need to build presence from scratch or can lean into demand capture.
Here’s the NAV43 Budget Allocation Framework:
| Sales Cycle | Deal Size | LinkedIn Allocation | Google Allocation |
|---|---|---|---|
| Under 90 days | Under $10K | 30% | 70% |
| 90-180 days | $10K-$50K | 50% | 50% |
| Over 180 days | Over $50K | 70% | 30% |
The principle behind these ratios: longer sales cycles and larger deals require more brand building before demand capture works. If your average deal takes 9 months to close and represents $100K+ in revenue, buyers are spending most of that journey in the 95%, forming opinions, building shortlists, and evaluating alternatives. That’s where LinkedIn dominates.
For shorter cycles and smaller deals, buyers move from awareness to purchase quickly. Google demand capture becomes more efficient because there’s less time for brand building to compound.
Adjusting for Brand Awareness Levels
These baseline ratios should shift based on your current brand position.
Low awareness (new market entrant, launching in a new vertical, unknown against established competitors): Increase LinkedIn allocation by 10-20%. You need to build presence before demand capture works. Buyers can’t choose you if they’ve never heard of you.
High awareness (established market leader, strong word-of-mouth, recognized brand name): Can lean harder into Google demand capture. Your brand equity compounds the effectiveness of bottom-funnel tactics.
How to assess your awareness level:
– Track branded search volume trends in Google Search Console. Growing volume indicates LinkedIn is building awareness.
– Run unaided recall surveys with target accounts. What brands come to mind when you ask about your category?
– Monitor your LinkedIn follower-to-impressions ratio. A high ratio suggests strong brand recognition among content viewers.
Attribution for the Long Game: How to Measure LinkedIn + Google Together
Here’s the core measurement problem: LinkedIn influences purchase decisions months before Google captures the lead. Traditional 30-day attribution misses this entirely. Last-click models give Google all the credit for journeys that LinkedIn actually won.
The solution is cohort-based attribution over extended windows. Track account cohorts from the first LinkedIn touch to Google conversion within 180-365-day windows. This matches your measurement approach to the actual 272-day buyer journey.
The tactical implementation varies by your tech stack, but the principle is consistent: you need to connect LinkedIn engagement data to CRM records, then follow those accounts through whatever channel eventually converts them.
96% of B2B marketers now use AI in their roles, with 47% ranking it as their #1 trend (Demand Gen Report, 2026). AI-powered attribution tools are making multi-touch, multi-month tracking increasingly accessible. If you’re still on last-click models, you’re flying blind.
LinkedIn Metrics That Actually Matter
Top-of-funnel metrics:
– Impression share among target accounts (are you reaching the right companies?)
– Engagement rate (are those accounts interacting with content?)
– Video view completion (are they consuming your message?)
Mid-funnel metrics:
– Lead Gen Form submissions (converting engaged audiences)
– Content download conversions (capturing contact information)
– Profile visits from target titles (individual buyer interest)
Influence metrics:
– Accounts touched via LinkedIn that later converted via Google
– Time from first LinkedIn touch to closed deal
– LinkedIn-engaged accounts’ win rate versus non-engaged accounts
What NOT to measure: Vanity metrics like total likes without account-level context. 1,000 likes from people who will never buy means nothing. 10 engagements from target account decision-makers could represent millions in the pipeline.
Google Metrics That Connect to LinkedIn Efforts
Branded search volume growth is your leading indicator of LinkedIn effectiveness. When LinkedIn builds brand awareness, more buyers search your name directly. Track this weekly in Google Search Console.
RLSA conversion rate versus cold audience conversion rate reveals the power of LinkedIn brand building. If LinkedIn-touched audiences convert at 2x the rate of cold audiences on Google, that’s your proof of cross-channel impact.
CPL delta between LinkedIn-touched accounts and net-new accounts shows the efficiency gain from brand building. Expect 20-40% lower CPL on accounts with prior LinkedIn engagement.
Time-to-conversion for accounts with prior LinkedIn engagement versus those without. LinkedIn-nurtured accounts should move through your sales process faster because trust is pre-built.
The NAV43 Full-Funnel Attribution Stack
Connect LinkedIn CAPI (Conversions API) to your CRM for first-party data sync. Layer Google Ads conversion data through offline conversion imports. Unify in HubSpot or your CRM with 180-365 day attribution windows. Build cohort reports that track accounts from first LinkedIn touch through closed-won.
For detailed HubSpot attribution configuration, see HubSpot Attribution Reporting: What to Track for Pipeline.
7 Mistakes That Kill LinkedIn + Google Full-Funnel Strategies
After implementing this framework with dozens of clients, we’ve identified the recurring mistakes that undermine results. Here’s what to avoid:
1. Measuring LinkedIn on 30-day windows. You’re judging a 272-day journey on 11% of the data. Extend your attribution windows to at least 180 days for LinkedIn touchpoints. Anything shorter gives Google credit for LinkedIn’s work.
2. Running Google Ads without LinkedIn brand building. You’re bidding for attention from people who don’t know you. In a world where 95% of winners are on the Day-1 shortlist, Google Ads without LinkedIn presence is competing for second place.
3. Treating LinkedIn as a lead gen channel only. The 95% don’t want your demo. They want value. If every piece of content ends with “book a call,” you’re optimizing for the 5% and alienating the 95% who determine future pipeline.
4. Ignoring personal profiles in favor of company pages. The 8x engagement differential is too significant to ignore. Your employees’ authentic voices consistently outperform branded content. Invest in executive visibility and employee advocacy.
5. Not integrating attribution between platforms. LinkedIn CAPI and Google Ads conversion data must connect to your CRM. Without this integration, you’re making budget decisions on incomplete data. HubSpot LinkedIn Lead Gen Integration covers the technical setup.
6. Spreading the budget evenly across all funnel stages. Match allocation to your sales cycle length. A 9-month sales cycle requires a different investment than a 2-month cycle. Use the framework above to right-size your LinkedIn versus Google split.
7. Expecting immediate ROI parity with Google. LinkedIn’s 121% ROAS is measured over 12 months, not 30 days (Dreamdata, 2026). If you evaluate LinkedIn on Google’s timeline, you’ll always cut it prematurely. Commit to the long game.
We see these mistakes constantly, even from sophisticated marketing teams. The common thread: treating LinkedIn and Google as separate channels rather than integrated stages of a single demand engine.
How AI Search Changes the LinkedIn-to-Google Playbook
Let’s address the elephant in the room. AI Overviews are compressing Google CTRs. Buyers increasingly get answers without clicking through to websites. Some categories have seen CTR compression exceeding 68% from AI-generated answers.
Does this make the LinkedIn-to-Google framework obsolete? No. It makes LinkedIn brand building MORE important.
When AI answers the search query directly, brand recognition determines who gets clicked for deeper exploration. If a buyer already knows and trusts your brand from LinkedIn exposure, they’ll seek out your perspective even when AI provides a surface-level answer. If you’re invisible until the search, you’re competing for the few remaining clicks against established players.
The evolution is already happening. Answer Engine Optimization (AEO) is emerging as the next layer of the strategy. Content structured for AI citation compounds the LinkedIn brand-building effect. When AI assistants mention your brand as a trusted source, you’re winning the shortlist battle at the AI layer before the buyer even reaches Google.
For deep dives on AI search optimization, explore AI SEO Content Strategy and How to Create AI-Ready Content.
The principle remains unchanged: build brand awareness before buyers enter the market, then capture demand when they do. The channels may evolve, but the 95-5 rule persists.
Conclusion: Key Takeaways
The full-funnel approach to LinkedIn and Google demand capture isn’t optional in 2026. It’s the price of admission for B2B pipeline growth.
Here’s what to remember:
- The 95-5 rule is your strategic foundation. Only 5% of your market is buying at any given time. The other 95% determines who wins when they enter the market. LinkedIn reaches the 95%; Google captures the 5%.
- Content ratios (5-3-2, 4-1-1, 3-2-1) are tactical implementations of the 95-5 principle. Choose based on your content capacity and industry, but always maintain a value-to-promotion balance that serves the 95%.
- Sequence matters. Start with LinkedIn organic, layer LinkedIn Ads, then capture demand on Google. Buyers who recognize your brand from LinkedIn click more and convert more on Google.
- Budget allocation depends on sales cycle length and deal size. Longer cycles and larger deals warrant greater investment in LinkedIn. Use the framework: under 90 days = 30% LinkedIn; 90-180 days = 50%; over 180 days = 70%.
- Measure on the buyer’s timeline, not yours. 272-day average journeys require 180-365-day attribution windows. Anything shorter misses LinkedIn’s true impact.
Next Steps
Immediate actions:
- Audit your current budget split between LinkedIn and Google. Does it align with your sales cycle?
- Identify 3-5 internal voices for LinkedIn organic content. Start building their profiles and publishing cadence.
- Extend your attribution windows to at least 180 days. Recalculate LinkedIn ROI with the corrected data.
- Implement RLSA campaigns that layer LinkedIn-sourced audiences onto Google Search.
- Connect LinkedIn CAPI to your CRM for first-party attribution data.
The buyers forming opinions about your brand today will search for solutions 8-10 months from now. Your LinkedIn investment today wins Google conversions next quarter. Your Google-only strategy today competes for scraps against brands that built the shortlist months ago.
Get a free NAV43 Growth Plan, and we’ll audit your current LinkedIn-to-Google demand capture approach, identify the gaps, and show you exactly where to invest for maximum pipeline impact.
The 95% are forming opinions right now. Make sure your brand is part of the conversation.
