2025 LinkedIn Ads Benchmarks Every SaaS & Tech Marketer Needs
LinkedIn Ads costs have surged 8% year-over-year, with cost per lead (CPLs) routinely exceeding $100 for B2B technology companies. If you’re running campaigns without a clear benchmark, you’re essentially flying blind in an increasingly expensive ecosystem where key benchmarks are crucial for success.
The data from 213 million impressions across 1,240 SaaS and tech campaigns reveals the metrics that separate top-performing accounts from the rest. Industry statistics show dramatic shifts in video engagement, cost structures, and bidding strategies that are reshaping what success looks like on the platform.
This benchmarking guide isn’t theoretical – it’s packed with actionable data to help you evaluate your campaign performance against industry standards and implement proven optimization strategies.
How We Compiled This Benchmark Data
Our benchmarking approach combines multiple data sources to provide the most comprehensive picture of LinkedIn Ads performance for SaaS and tech companies. This approach ensures that we provide detailed insights into the performance of LinkedIn Ads for SaaS and tech companies.
The dataset encompasses:
- 213 million impressions
- 4.6 million clicks
- 1,240 SaaS and tech campaigns
- Markets spanning North America and the EMEA regions
We’ve blended proprietary NAV43 campaign data with insights from leading industry sources, including Dreamdata, AdBacklog, Huble, Getuplead, and Zweidigital. All metrics have been normalized to USD using Q1-Q2 2025 exchange rates to ensure consistent comparison.
Understanding the Target Audience
To create effective LinkedIn ads, it’s essential to understand your target audience. This includes identifying their job titles, industries, company sizes, and other relevant demographics. By understanding your audience’s needs, interests, and pain points, you can create ads that resonate with them and drive engagement. LinkedIn’s targeting options allow you to reach specific audiences based on their profile information, making it easier to connect with the people who matter most to your business. Additionally, LinkedIn’s audience insights tool provides valuable information about your target audience, including their interests, skills, and job functions, helping you to refine your targeting and create more effective ads.
SaaS & Tech LinkedIn Ads Benchmarks at a Glance
Based on our comprehensive analysis, here are the current 2025 LinkedIn Ads benchmarks for SaaS and tech companies:
| Metric | Median | Top-Quartile | Source |
| CTR | 0.50% | > 0.60% | AdBacklog |
| CPC | $7.85 | < $5.00 | Zweidigital, Getuplead |
| CPM | $38 | < $30 | Zweidigital |
| CPL | $128 | < $90 | AdBacklog |
Understanding the average click through rate (CTR) across different industries helps in evaluating engagement and audience interest.
Key finding: The gap between median and top-quartile performers is substantial. Companies in the top 25% are achieving click costs that are nearly 40% lower than the median, demonstrating that optimization can dramatically improve efficiency despite rising platform costs.
Funnel Stage Benchmarks
LinkedIn campaign performance varies significantly depending on your campaign goals and which stage of the funnel you’re targeting. Here’s how the numbers break down across the customer journey:
Awareness (Brand) Campaigns
At the top of the funnel, brand awareness campaigns should be evaluated primarily on CPM metrics:
- Median CPM: $31
- Impression share: Typically 3-5% of total addressable audience per month
- Frequency cap sweet spot: 2-3 impressions per user weekly
Monitoring ad engagement is crucial to ensure that your brand awareness campaigns are resonating with your target audience.
What’s working: Companies using LinkedIn’s interest targeting in combination with company targeting are seeing 15% lower CPMs than those using job title targeting alone.
Consideration (Traffic) Campaigns
Mid-funnel campaigns focused on driving website visits or content engagement show these benchmarks:
- Median CTR: 0.56% for single-image Sponsored Content
- Median CPC: $5.90
- Best performing format: Single-image Sponsored Content continues to outperform carousels and text ads for CTR
What’s working: Content that focuses on industry insights and data points garners 22% higher engagement than product-focused messaging at this stage. Content that focuses on industry insights and data points is particularly effective at driving engagement at this stage.
Conversion (Lead Generation) Campaigns
Bottom-funnel lead generation efforts show:
- Lead form conversion rate: 6-10%
- Landing page conversion rate: 3-5%
- CPL with lead forms: $75-150
- CPL with landing pages: $100-200
What’s working: Lead gen forms can reduce CPL by approximately 25% compared to landing page conversions, but often at the expense of lead quality. While lead-gen forms can reduce CPL, it’s essential to ensure that you’re still attracting high-quality leads.
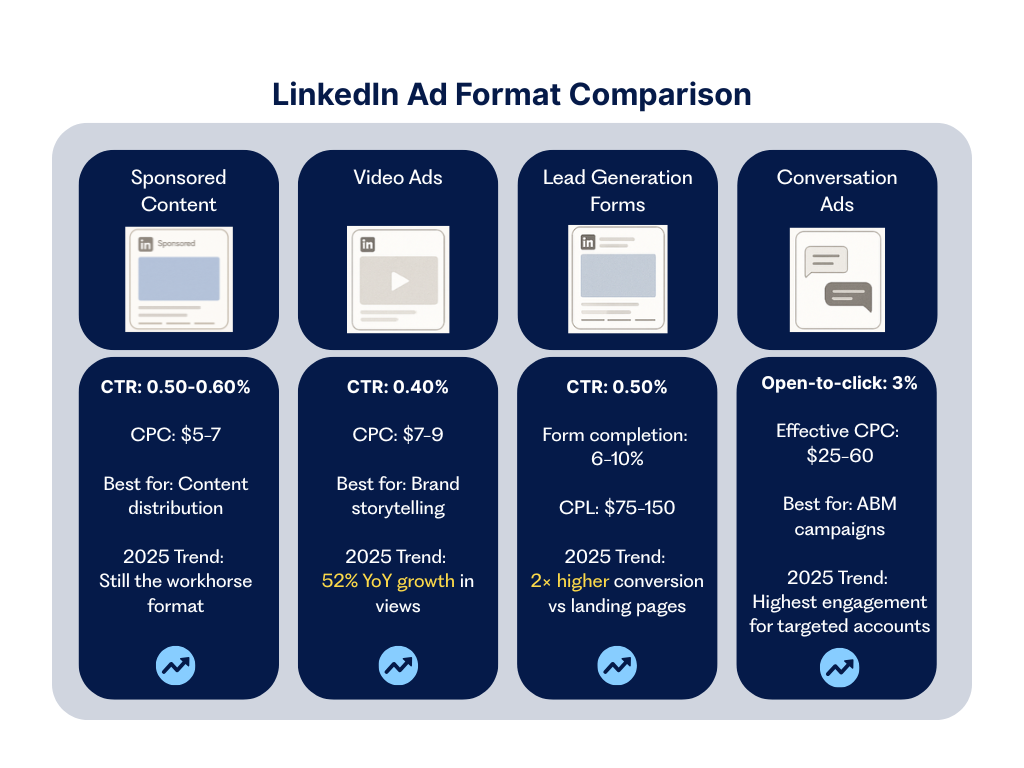
Performance by Ad Format
Different LinkedIn ad formats deliver varying performance metrics. Here’s what our data reveals:
Sponsored Content (Single Image)
- CTR: 0.50-0.60%
- CPC: $5-7
- CPL: $100-200
- Notable trends: Still the “workhorse” format for most B2B campaigns, offering the best balance of reach and performance. Recognizing these notable trends can help optimize ad campaigns and improve strategies based on industry benchmarks and data-driven insights.
Video Ads
- CTR: 0.40%
- CPC: $7-9
- View completion rate: 25-40% for 15-second spots
- Notable trend: 52% year-over-year growth in video views, with engagement rates climbing as more high-quality content enters the ecosystem
While video ads are growing in popularity, it’s important to compare their performance with other formats to ensure you’re using the most effective ad type for your campaign goals.
Lead Generation Forms
- CTR: 0.50%
- CPC: $5-7
- CPL: $75-150
- Form completion rate: 6-10%
- Notable trend: Nearly double the conversion rate compared to landing pages, but often with lower intent signals. Monitoring conversion metrics is essential to ensure that your lead generation forms are effectively capturing high-quality leads.
Conversation Ads
- Open-to-click rate: 3%
- Cost per send: ~$0.50
- Effective CPC equivalent: $25-60
- Notable trend: Highest performing format for ABM (Account-Based Marketing) campaigns, with B2Linked reporting 4x higher engagement for targeted account lists. Conversation Ads are designed to drive more interactions between members and businesses, making them highly effective for ABM campaigns.
Text Ads
- CTR: 0.025-0.035%
- CPC: $3-5
- Notable trend: Declining inventory share but still effective for brand awareness at scale. Text Ads can be particularly effective for targeting niche audiences, despite their declining inventory share.
Industry-Specific Benchmarks: SaaS vs. FinTech vs. HR-Tech
Performance varies significantly across technology sub-sectors. Here’s how different verticals compare:
Aligning your campaigns with industry trends can help you stay competitive and achieve better performance metrics.
SaaS (General)
- CTR: 0.42%
- CPC: $5-8
- CPL: $100-160
- Sales cycle: 3-6 months
Performance insight: General SaaS campaigns face moderate competition but benefit from broad targeting options and established conversion patterns.
FinTech
- CTR: 0.38%
- CPC: $8-12
- CPL: ≥$180
- Sales cycle: 6-12 months
Performance insight: FinTech faces the highest competition levels and regulatory scrutiny, driving up costs but also delivering higher lifetime customer values.
HR-Tech
- CTR: 0.58%
- CPC: $4-7
- CPL: $90-140
- Sales cycle: 2-4 months
Performance insight: HR-Tech benefits from highly defined audience targeting and lower competition, resulting in better engagement metrics and shorter sales cycles.
What’s working: Industry-specific campaigns that incorporate vertical-focused social proof (case studies, testimonials) consistently outperform generic tech messaging by 15-20% across all metrics.
2025 LinkedIn Ads Trends Reshaping the Landscape
The LinkedIn advertising ecosystem continues to evolve rapidly. Here are the most impactful trends we’re seeing in 2025:
Benchmarking your performance against industry leaders can provide valuable insights and help you improve your LinkedIn Ads strategies.
Budget Migration Toward LinkedIn
- 39% of B2B marketers are increasing LinkedIn spend while reducing other platform investments
- ROAS on LinkedIn averaging 113%, outperforming both Google (98%) and Meta (104%) for B2B SaaS
LinkedIn’s ROAS is outperforming other platforms, making it a preferred choice for B2B marketers.
Why it matters: Increased competition for LinkedIn inventory will continue to drive up costs, making optimization increasingly important.
Video Inventory Expansion
- LinkedIn’s creator-led content push has expanded video inventory by 74%
- Video ads now constitute 28% of all LinkedIn impressions, up from 17% in 2024
- Initial data suggests lower CPMs but also lower CTRs as users adapt to the format
In addition to video ads, LinkedIn Live is becoming an increasingly popular tool for engaging with professionals in real-time.
How to respond: Develop short-form (under 15 seconds) video content specifically for the LinkedIn feed rather than repurposing content from other channels.
CAPI Adoption Accelerating
- Advertisers using LinkedIn’s Conversions API see approximately 20% lower CPA
- Enhanced attribution captures 18-22% more touchpoints in the B2B buyer journey
- Privacy-focused tracking becoming essential as third-party cookies phase out
Why it matters: CAPI implementation provides substantial competitive advantage in bidding efficiency and attribution accuracy. LinkedIn’s CPC and CTR are influenced by competitive dynamics and audience engagement trends, making it crucial to understand these metrics for optimizing ad strategies on the platform.
Quality Score Influence Growing
- Campaigns with CTRs exceeding 0.7% enjoy approximately 15% lower CPCs
- LinkedIn’s algorithm increasingly rewards engagement over bid amount
- Ad relevance scoring now incorporates post-click engagement metrics
Improving ad quality can lead to lower CPCs and better overall campaign performance.
How to respond: Focus on tight audience-message alignment over bid manipulation to drive sustainable performance improvements.
Data-Driven Recommendations for 2025 Campaigns
Based on our benchmark analysis, here are actionable strategies to improve your LinkedIn Ads performance:
Implementing effective ad strategies can help you optimize your LinkedIn Ads campaigns and achieve better results.
Optimize Your Bidding Strategy
- Start with cost-cap bidding: Begin new campaigns with cost-cap bidding to establish baseline performance
- Switch to manual once stable: After collecting 2-3 weeks of data, transition to manual bidding with day-parting focused on high-conversion periods
- Test bid pacing: According to WordStream’s analysis, setting daily budgets 30% higher than your target spend with aggressive bid caps often delivers better overall efficiency. Choosing the right bidding option can significantly impact your overall advertising expenses and campaign performance.
Implement Creative Rotation Systems
- 14-day refresh cycle: Metricool’s study found CTR typically declines after two weeks of exposure to the same creative
- A/B test methodology: Test imagery first, then headlines, then body copy to isolate variables
- Performance floor: Establish CTR thresholds (0.45% minimum) to automatically pause underperforming creatives
Leverage ABM Audience Layering
- Create audience stacks: Combine company targeting with seniority and department filters
- Size tiers: Segment target accounts into 3 tiers based on potential value
- Format matching: Use Conversation Ads for top-tier accounts (3%+ CTR) and Sponsored Content for broader reaches
Ensuring that you’re reaching a relevant audience is crucial for the success of your ABM campaigns.
Work with a LinkedIn Ads agency for SaaS
Enable CAPI for Advanced Optimization
- Implement server-side tracking: Set up Conversions API to capture post-click activity
- Optimize for pipeline metrics: Adjust campaigns based on actual sales progression, not just lead volume
- Create custom events: Track micro-conversions like pricing page visits, feature exploration, and repeat visits
Tracking key metrics is essential for optimizing your campaigns and ensuring that you’re meeting your performance goals.
Ad Spend Optimization
Optimizing your ad spend is crucial to ensuring that your LinkedIn ads are effective and efficient. This involves setting a budget, bidding on ad space, and monitoring your ad performance to make data-driven adjustments. By using LinkedIn’s automated bidding options, you can ensure that your ads are seen by the right people, at the right time, and at the right price. Additionally, LinkedIn’s ad spend optimization tools provide valuable insights into your ad performance, allowing you to identify areas for improvement and make adjustments to your ad campaigns. By optimizing your ad spend, you can maximize your return on investment (ROI) and achieve your marketing goals.
LinkedIn Ads Best Practices
To get the most out of your LinkedIn ads, it’s essential to follow best practices. This includes creating high-quality ad content, using attention-grabbing headlines and images, and optimizing your ad targeting. Additionally, it’s essential to monitor your ad performance regularly, making adjustments to your ad campaigns as needed. By using LinkedIn’s ad analytics tools, you can gain valuable insights into your ad performance, including click-through rates, conversion rates, and cost per click (CPC). By following best practices and using LinkedIn’s ad analytics tools, you can create effective ad campaigns that drive real results for your business.
Ad Creative Optimization
Ad creative optimization is the process of refining and improving your ad content to drive better performance. This includes testing different ad formats, such as single image ads, carousel ads, and video ads, to see which ones resonate best with your target audience. Additionally, it involves optimizing your ad headlines, images, and copy to ensure that they are attention-grabbing and relevant to your target audience. By using LinkedIn’s ad creative optimization tools, you can test different ad creatives, identify top-performing ads, and make data-driven decisions to improve your ad campaigns. By optimizing your ad creative, you can drive more engagement, conversions, and ultimately, revenue for your business.
How to Interpret This Benchmark Data
While benchmarks provide valuable context, they require proper interpretation to be actionable.
Using benchmarks can help you identify opportunities for improvement and optimize your LinkedIn Ads campaigns.
Statistical vs. Practical Significance
Not all deviations from benchmarks require action. Generally, consider these guidelines:
- CTR variance: Take action if your CTR is 20% below benchmark
- CPC variance: Investigate if costs exceed benchmarks by 15% or more
- Conversion variance: Most concerning metric – prioritize optimization if conversion rates are 10%+ below benchmark
Understanding the average CTR can help you determine whether your campaign performance is within an acceptable range.
Build Your Private Benchmark
The most valuable benchmark is your own historical performance. We recommend:
- Creating a Google Looker Studio dashboard to track your metrics against these industry benchmarks
- Segmenting by campaign objective, audience type, and creative format
- Establishing quarterly review cycles to identify trends in your specific accounts
Tracking your marketing performance against your own historical data can provide more actionable insights than industry averages.
Pro tip: Your performance relative to your own historical data is often more actionable than comparison to industry averages.
Putting These Benchmarks into Action
LinkedIn Ads costs continue to climb, with the 8% year-over-year increase in CPC and median CPLs exceeding $100 representing significant challenges for SaaS marketers. However, our benchmark analysis reveals clear patterns that distinguish top-performing campaigns:
- Format specialization matters: Match formats to funnel stages deliberately rather than using a one-size-fits-all approach
- Audience refinement delivers: Top-quartile performers use 30% more audience filters than median performers
- Technical implementation separates leaders: CAPI adoption and strategic bidding create compounding advantages. If you’re implementing CAPI, expect better attribution and optimization signals.
The data is clear – companies that benchmark their performance and implement systematic optimization consistently outperform those running campaigns based on assumptions. Using benchmarks to prove ROI can help you demonstrate the value of your advertising campaigns to stakeholders.
Want expert guidance?Schedule a free LinkedIn Ads audit with our team to uncover specific optimization opportunities in your accounts.
-
A realistic median CTR for SaaS/Tech feed formats is about 0.50–0.65%. Teams in the top quartile commonly reach ~0.80–1.00%+. If you’re consistently under ~0.45% on feed, review audience fit, hook, and thumb-stop (first line/first frame).
-
With Lead Gen Forms (LGF), a practical CPL band is ~$75–$150. With Landing Pages (LP), expect ~$100–$200+ depending on geo, offer, and intent. Native forms tend to convert a higher share of clicks; LPs often yield higher-intent leads. Always judge programs on SQL/Opportunity rate (not CPL alone).
-
In our 2025 SaaS/Tech dataset, Document and Single-Image ads most often produce the lowest CPL among feed formats—especially when paired with Lead Gen Forms. Conversation Ads can be efficient for ABM motions when CPS is competitive and targeting is tight.
